4 Visualization in Oracle Spatial Studio
You can visualize your spatial data in Oracle Spatial Studio using different modes of visualization.
Spatial Studio supports the following visualization methods:
- Table
- Map
- Cesium-Map
You can save your visualization as a Project in Spatial Studio. You can rework on a project or publish a project to share the results with other users.
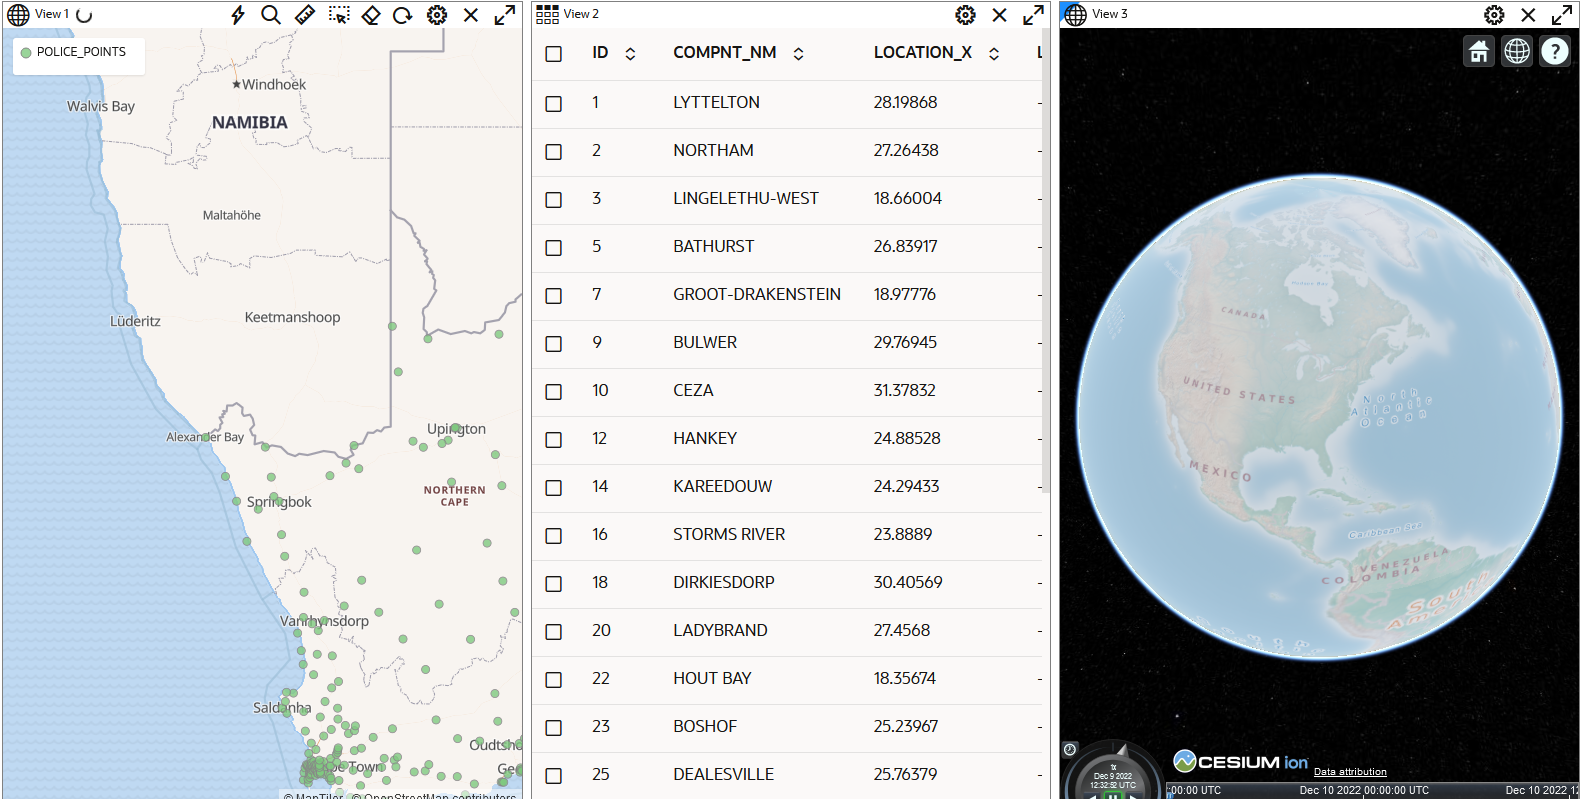
Note that Spatial Studio supports multiple map visualizations as shown:
The following sections explain in detail each of these visualization techniques:
- Using a Table Visualization
Spatial Studio allows you to visualize your data from the dataset in tables. - Using a Map Visualization
Spatial Studio supports several types of map visualizations. - Using a Cesium Map Visualization
Spatial Studio uses a CesiumJS plugin that allows you to view 3D visualizations using 3D Tiles or CZML data on a Cesium map. - Styling a Map Layer
Spatial Studio allows you to explore different styling options for your map layers, in order to enhance visualization and analysis. - Filtering Data on a Map Layer
You can filter on an attribute column of a dataset to determine the data points that must be displayed on a map visualization. - Adding Interactions to a Map Visualization
You can enhance your map interaction by configuring tooltips and info windows for the map layers used in the map visualization. - Multiple Visualizations on a Canvas
You can work on multiple visualizations in Spatial Studio. - Configuring a Map Visualization
Learn how to configure the settings for your map visualization. - Searching Locations and Features on a Map
Using the Search option, you can quickly find locations and features on a map. - Changing the Pitch and Bearing of a Map
You can set the pitch and bearing of a map by tilting or rotating your map in the map visualization panel.
