Setting Up the Key Performance Indicators Portlet
If you want to display KPI data on a dashboard, the first step is to add the Key Performance Indicators portlet to the page if it is not already there.
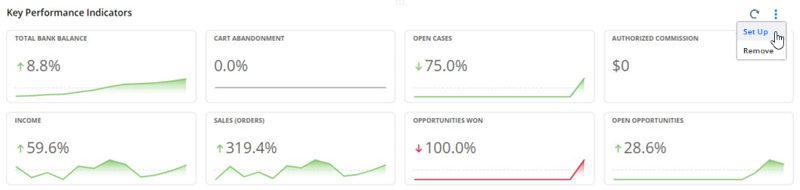
When the Key Performance Indicators portlet appears on a page, you can click Set Up and define its content and layout in the Set Up Key Performance Indicators popup window. You can add up to eight KPIs as headlines.
The KPIs that are available to you in the Set Up Key Performance Indicators popup window depend upon the role you used to log in to NetSuite and the features that are enabled.
For more information, see the following:
Adding the Key Performance Indicators Portlet
To add the Key Performance Indicators portlet:
-
Click Personalize Dashboard.
-
Click or move the Key Performance Indicators item.
The portlet shows up on your page with default or previously selected KPI data.
Making Changes to the Key Performance Indicators Portlet
You can make the following changes to the Key Performance Indicators portlet:
-
Select the standard and custom KPIs that appear in the portlet.
-
Select the period of time for which you want KPI data to be synthesized.
-
Choose to display comparisons of KPI data across different time periods, with percentage changes calculated automatically.
-
Choose to highlight displayed KPI data that exceeds or falls short of a threshold that you define.
-
Set some KPI data to appear in the portlet header.
-
Determine the order in which KPIs appear in the portlet.
-
For KPIs that provide time-based comparisons of data, define layout options for the popup trend graphs that are available from Trend Graph icons or by clicking the KPIs in the header.
-
You may be able to choose whether to display data for all employees or employees in your team.
Choosing KPIs and Setting Layout Options
To define KPIs and layout options for the Key Performance Indicators portlet:
-
In the Key Performance Indicators portlet, click Set Up to open the Set Up Key Performance Indicators popup.
-
To select standard KPIs for display in the portlet, click Add Standard KPIs to open the Choose Standard Key Performance Indicators dialog.
-
Click a KPI in the left list to move it to the right list, which indicates that it should be displayed.
-
Click Done when you're finished picking KPIs to display.
-
Selected standard KPIs are listed with question mark icons. Click these icons for KPI descriptions. For a complete list of standard KPIs and their descriptions, see Standard Key Performance Indicators Table.
-
-
To select saved searches to display as custom KPIs, click Add Custom KPIs to open the Choose Custom Key Performance Indicators dialog.
-
Click a saved search in the left list to move it to the right list, which indicates that it should be displayed as a custom KPI.
-
You can choose up to 10 custom KPIs.
-
Click Done when you're done picking KPIs to display.
-
Selected custom KPIs are listed with 'c' icons. Click an icon for a brief general description of custom KPIs. For more details, see Custom KPIs.
-
-
For each selected KPI, in the Range list, select the date or period range for which data should be included.
-
For each selected KPI, if an Employees list is available, select one of the following:
-
All - Includes KPI data for all employees in your organization.
-
Only Mine - Includes data only from employees in your group in a selected KPI.
-
My Team's - Includes only KPI data that is relevant to employees in your team.
-
-
For each selected KPI, in the Highlight If list, highlight displayed KPI data that exceeds or falls short of a defined threshold. If you do not want highlighting for this KPI, leave the list blank. For more details, see Highlighting KPIs.
-
For each selected KPI, in the Compare column, check the box if you want to compare results from the time period defined in the Range list with results from another period defined in the Compare Range list. For more details, see Setting Up KPI Comparisons.
-
For each selected KPI, in the Compare Range list, if you checked the Compare box, select the date or period range for which data should be compared with data from the first range. If you did not check the Compare box, you do not need to make a selection here.
-
You can remove a selected KPI from the Key Performance Indicators portlet by clicking its x button at far right. Click Remove All button to remove all selected KPIs.
-
You can change the order in which KPIs appear in the Key Performance Indicators portlet by using the Move To Top and Move To Bottom buttons or by dragging and dropping individual KPIs.
-
To move a KPI, click it and hold down the mouse button until you see the crossed arrows and the KPI is highlighted gray. Continue holding down the mouse button, moving the pointer to the location where you want the KPI to appear. Then release the mouse button.
-
To use one of the Move buttons, select a KPI by clicking on it and holding down the mouse button until you see the crossed arrows and the KPI is highlighted gray. Then click either of the Move buttons.
-
-
To change display options for KPIs' popup trend graphs, click the Popup Trend Graphs subtab.
Check or clear the Show Moving Average, Show Last Data Point on Pop-Up Trend Graphs, or Include Zero on Y-Axis boxes. You can also set the chart theme and background for all popup trend graphs, plus the default chart type and time increment. For information about these options, see Setting Up Popup Trend Graphs.
-
If you don't want the portlet to refresh automatically when you log in to NetSuite, select the Cached Data option.
This option also adds a time indicator that appears when you point to the portlet title, so you can see when the portlet was last updated.
-
Click Save.
You can now review the data displayed in the Key Performance Indicators portlet. To make further changes, click Set Up and redo the steps above as needed. For tips about what you can do in the portlet, see Viewing Key Performance Indicator Data.