Investigating Issues with Performance Health Dashboard Tables
When you click a tile on the Performance Health Dashboard, you'll see detailed tables for each issue type found in your account. Each issue type appears on its own subtab.The dashboard shows an All Issues subtab if there's more than one issue type in your account.
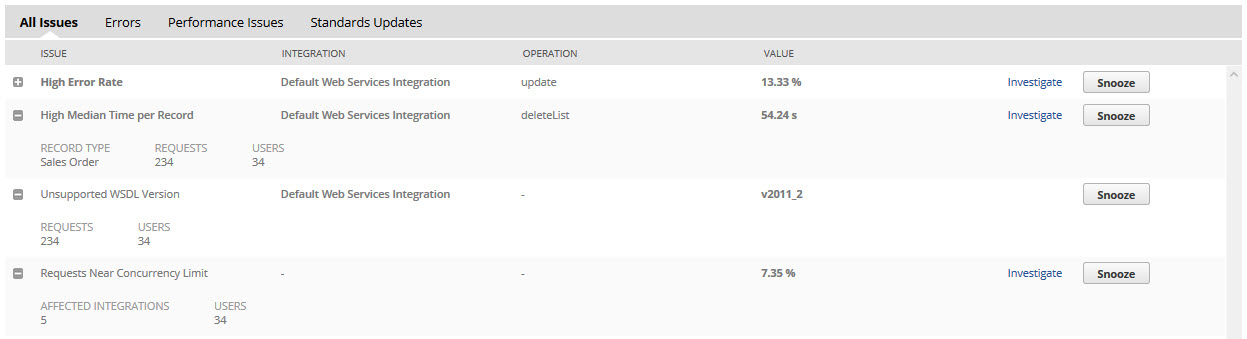
For more information about the list of issues on the tables, see Performance Health Dashboard Issues and Issue Types.
For more information about the columns on the tables, see Performance Health Dashboard Table Columns.
Performance Health Dashboard Table Columns
The columns on the table vary depending on the process you're investigating. The following table shows columns for all processes and those that appear only for specific processes.
|
NetSuite Process |
Column |
Description |
|---|---|---|
|
All Processes |
Issue |
Shows the issue name. |
|
Value |
Shows the value for the issue, which may be in time, percentages, or other formats. |
|
|
Investigate Link |
This column may show an Investigate link to other tools in the APM SuiteApp. |
|
|
Snooze Button |
Shows a Snooze button that hides an issue from the table when clicked. For more information, see Snoozing Issues in the Performance Health Dashboard. |
|
|
Record Pages |
Record Type |
Shows the record type name. |
|
Operation |
Shows the operation name. |
|
|
Scripts |
Script Name |
Shows the script name. |
|
Deployment ID |
Shows the script deployment ID. |
|
|
Stage |
For map/reduce scripts, this column shows the stage the script was processing when it encountered the issue. |
|
|
Saved Searches |
Saved Search |
Shows the saved search name. |
|
Record Type |
Shows the saved search record type. |
|
|
Integrations |
Integration |
Shows the integration name. |
|
Operation |
Shows the integration operation name when it encountered the issue. |
|
|
Processors |
- |
- |
Performance Health Dashboard Issues and Issue Types
The dashboard shows different issues depending on the process and issue type you're investigating. The following table shows the issues that are included for each issue type:
|
NetSuite Process |
Issue Type |
Issue |
Description |
|---|---|---|---|
|
Record Pages |
Performance Issue |
High Median Response Time |
Alerts you to high median response time for record instances during the selected period. |
|
Scripts |
Error |
High Error Rate |
Alerts you to high error rates for script deployments during the selected period. |
|
Standards Update |
Deployments over 100 |
Alerts you to scripts that exceed 100 deployments during the selected period. |
|
|
Saved Searches |
Performance Issue |
High Median Request Time |
Alerts you to high median execution time for saved searches during the selected period. |
|
High Timeout Rate |
Alerts you to a high timeout rate for saved searches during the selected period. |
||
|
Integrations |
Error |
High Error Rate |
Alerts you to high error rates for integrations during the selected period. |
|
High Error Rate for Account Concurrency |
Alerts you to high error rates from requests that exceeded the account concurrency limit during the selected period. |
||
|
High Error Rate for User Concurrency |
Alerts you to high error rates from requests that exceeded the user concurrency limit during the selected period. |
||
|
Performance Issue |
High Median Time per Record |
Alerts you to high median execution time for each record during the selected period. |
|
|
Standards Update |
Unsupported WSDL Version |
Shows integrations during the selected period that still use unsupported WSDL versions. |
|
|
Requests Near Concurrency Limit |
Measures how much of your integrations register requests near the concurrency limit during the selected period. |
||
|
Processors |
Performance Issue |
High Average Wait Time |
Alerts you to high average wait times to complete jobs during the selected period. |
|
High Rate of Failed Jobs |
Alerts you to a high rate of failed jobs during the selected period. |
||
|
Low Usage of Reserved Processors |
Shows the ratio of times high-priority job processors were below 50% during the selected period. |