Monitoring Account Performance
Use the Performance Health Dashboard in the APM SuiteApp to monitor issues that may affect record pages, scripts, saved searches, integrations, and processors.
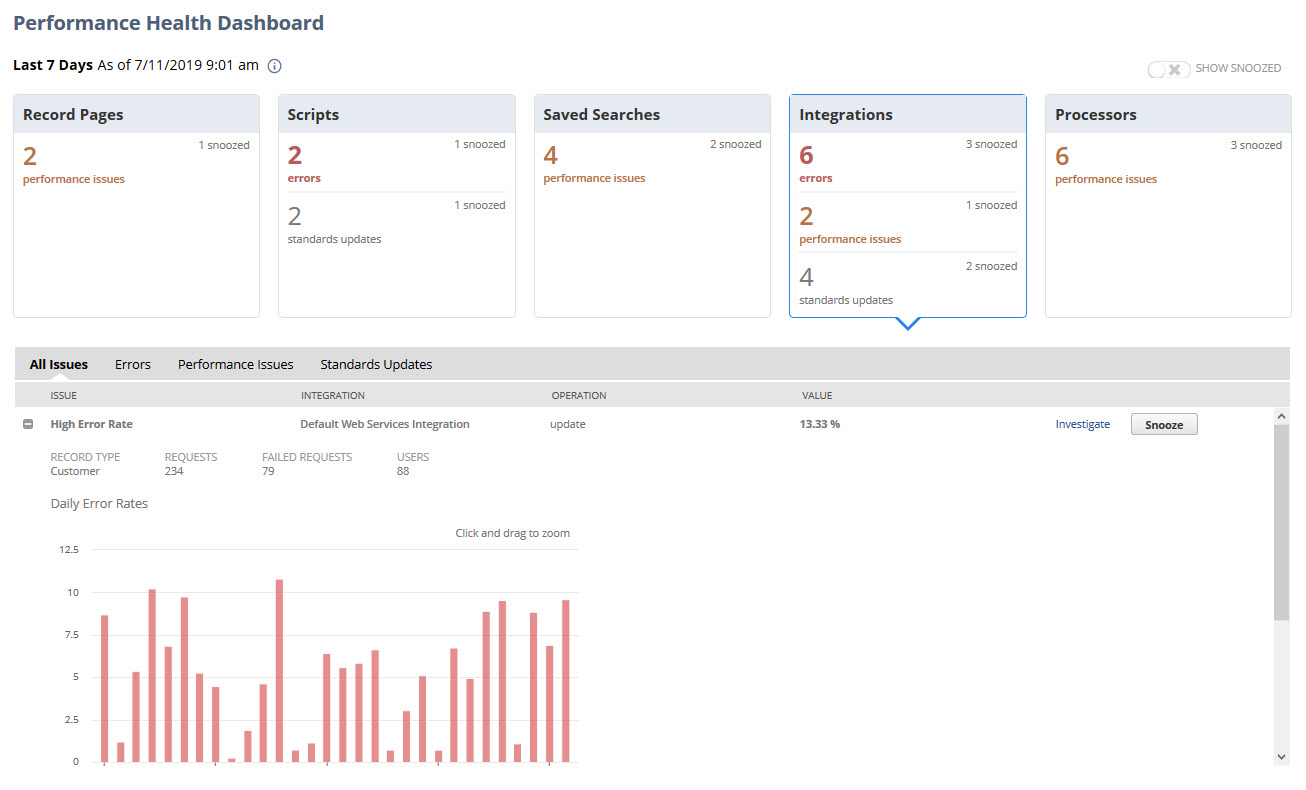
The Performance Health Dashboard is a visual tool that shows high-level account issues using tiles, figures, and tables. From the dashboard, you can open other APM SuiteApp tools to investigate issues. Use the dashboard as your starting point for troubleshooting.
Your performance logs aren't included when your NetSuite account moves to the new data center on Oracle Cloud Infrastructure (OCI). For the first 29 days after the move, the displayed values will be based on data collected since the move, not the last 30 days.
For more information about the dashboard, see the following help topics:
Related Topics
- Using the Application Performance Management Tools
- Monitoring Record Pages
- Monitoring Performance with the Page Time Summary
- Using Page Time Details
- Analyzing Scripts
- Monitoring SuiteCloud Processors Performance
- Analyzing Web Services Performance
- Analyzing Search Performance
- Monitoring Web Services and RESTlet Concurrency
- Profiling Operations Performance