Dashboard Portlets in NetSuite for iOS
NetSuite for iOS enables you to use all web dashboards. If you add portlets available in NetSuite for iOS to any of your dashboards in a browser session, the portlets display on your corresponding mobile dashboard. See Dashboard Personalization.
To switch between dashboards, tap the name of the currently displayed dashboard, and then tap the dashboard you want to access from the list.
The following table lists portlets available with NetSuite for iOS.
To add a portlet to My Dashboard, tap the Star icon.
|
Portlet Name |
Description |
Screenshot |
|---|---|---|
|
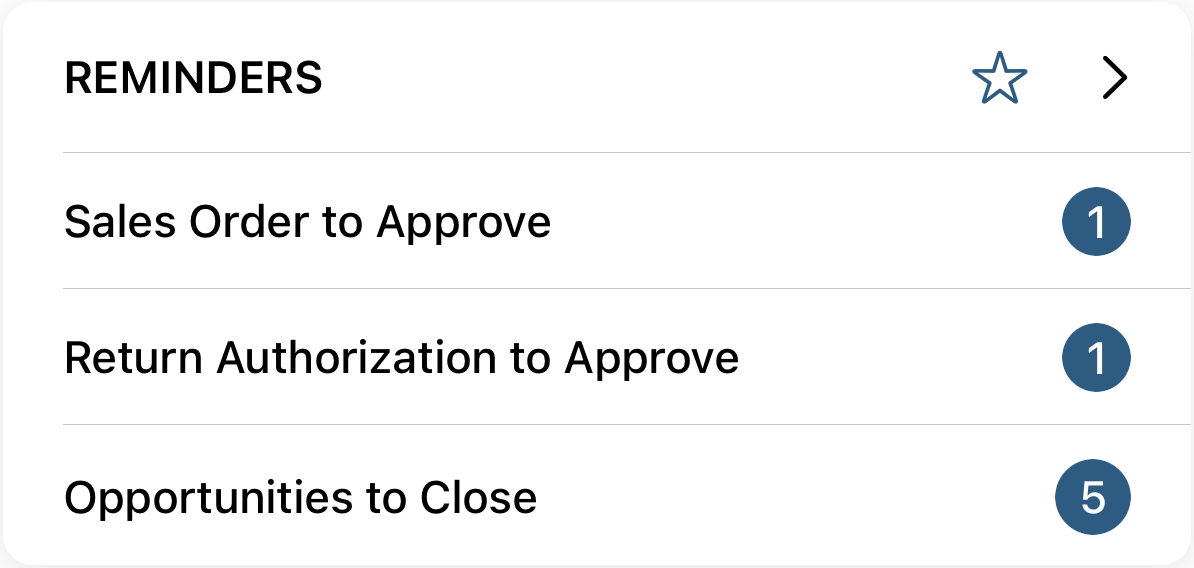
Reminder |
Displays the first three reminders you would see on your browser session dashboard. To see the full list of reminders, tap the Arrow icon |
|
|
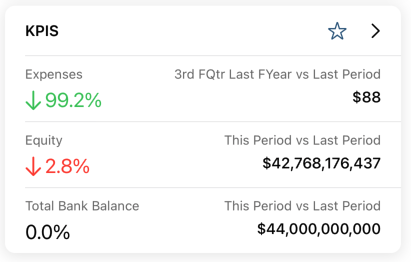
Key P |
The default behavior is to display the first three KPIs from your browser session Dashboard. If you have set up headline KPIs, their settings override this behavior. tap the Arrow icon |
|
|
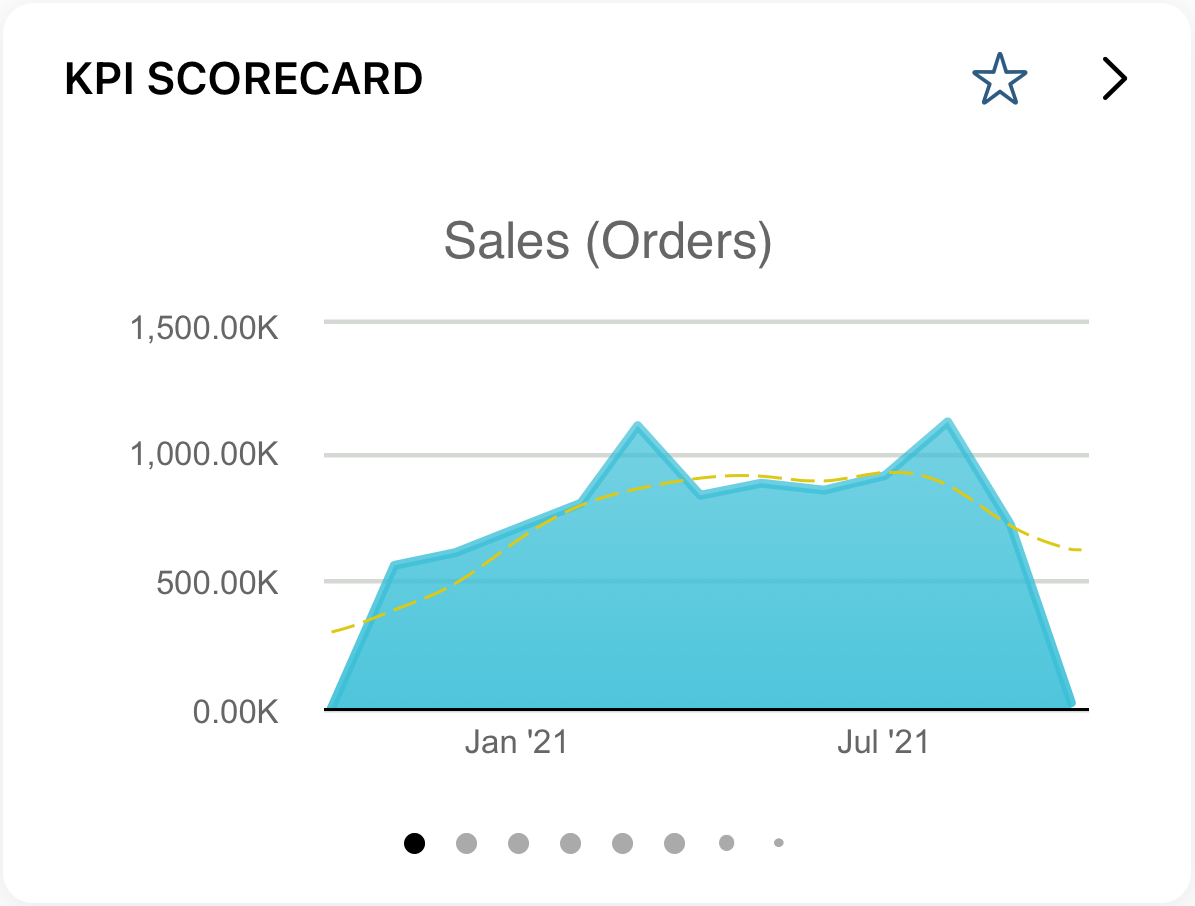
KPI Scorecard |
Displays KPI scorecards as configured on your browser session dashboard. To browse through your scorecards, swipe left or right. Tap a scorecard to access the chart detail. To see your full list of KPI Scorecards, tap the Arrow icon |
|
|
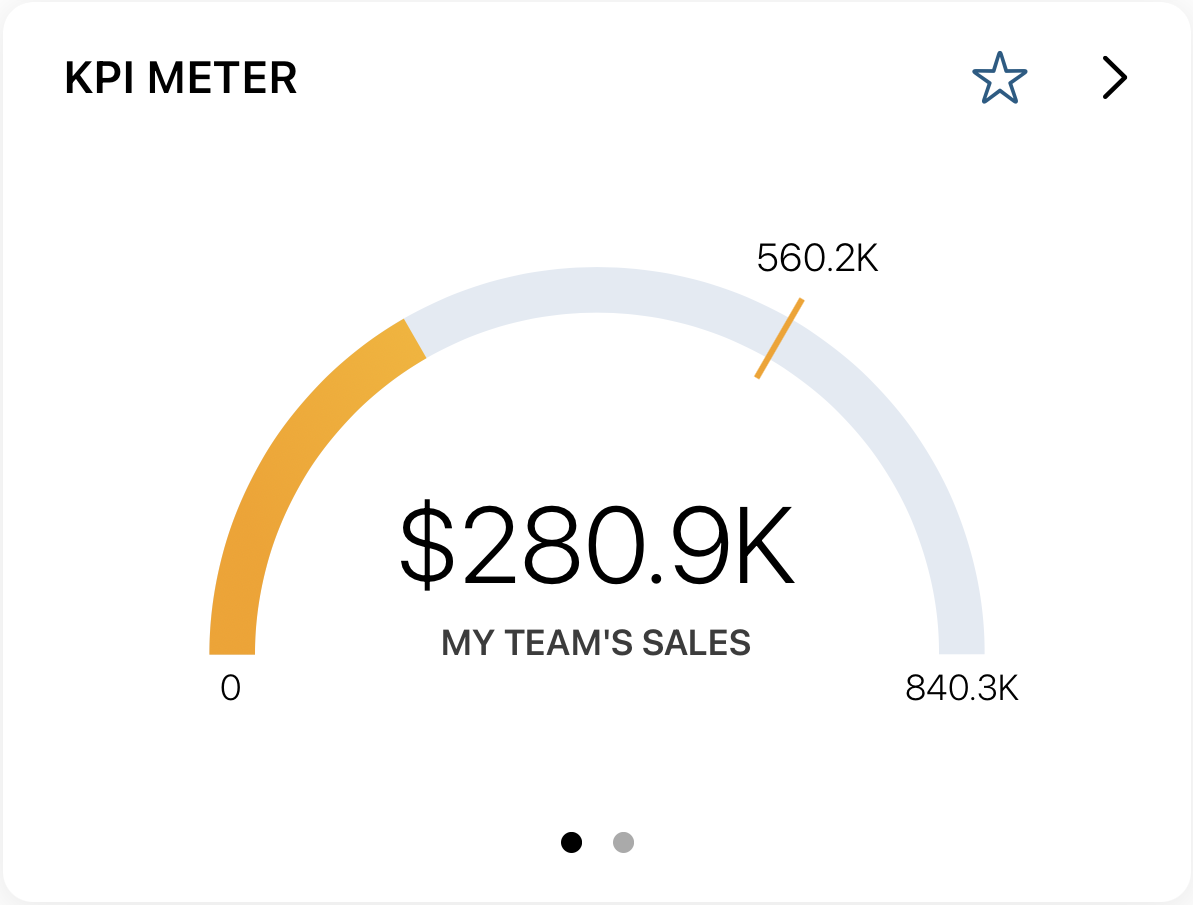
KPI Meter |
The portlet displays the first KPI Meter as configured in your browser session. To browse through your KPI meters, swipe left or right. For more information, see KPI Meters. |
|
|
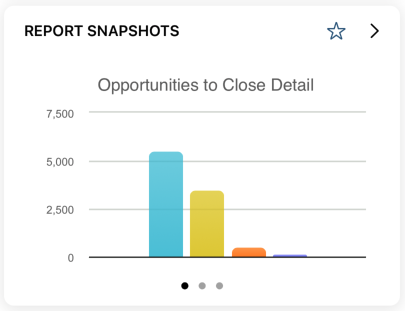
Report Snapshot |
The portlet displays the first report snapshot from your browser session Dashboard. Tap the Arrow icon |
|
|
Custom Searches |
The portlet displays the first three custom search portlets from your browser session Dashboard. Tap the Arrow icon |
|
|
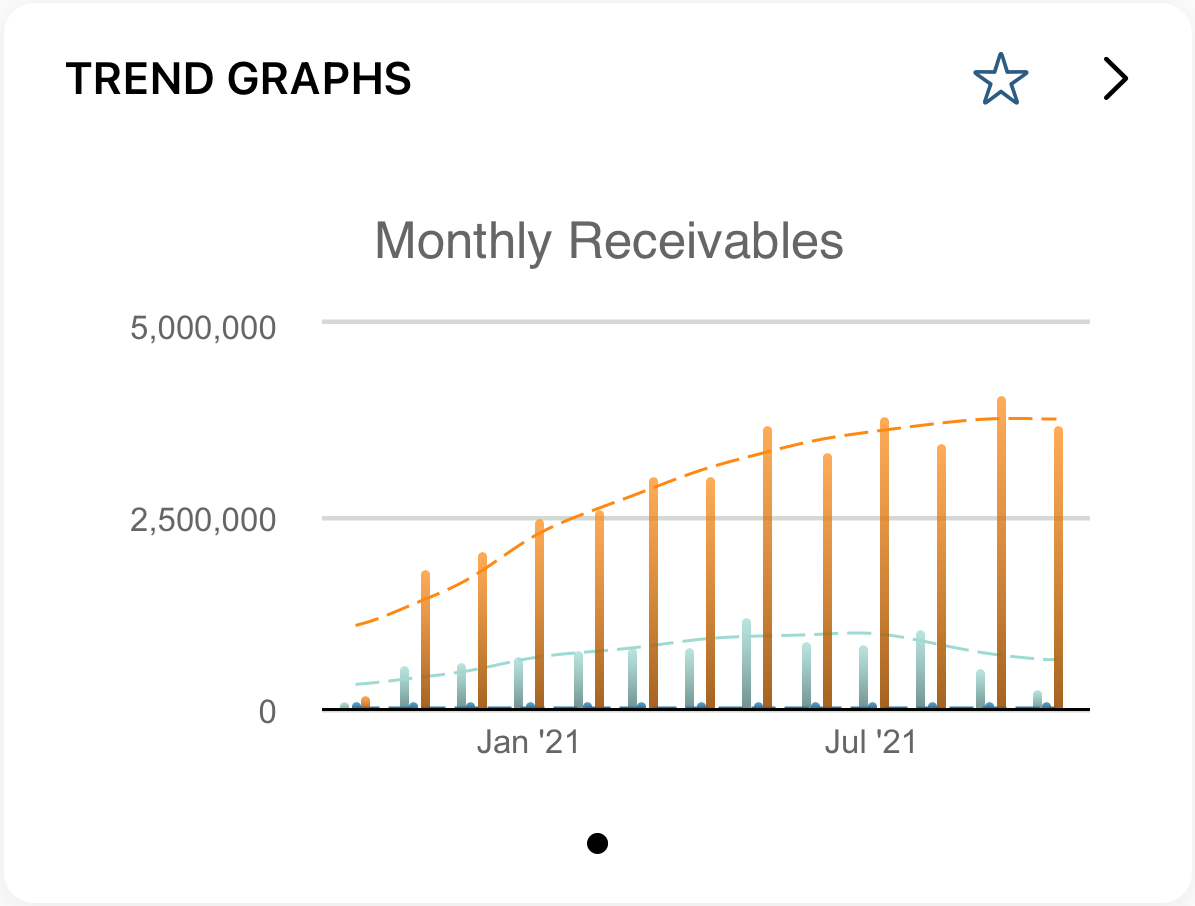
Trend Graphs |
The portlet displays the first trend graph from your browser session dashboard. To browse through your trend graphs, swipe left or right. Tap a trend graph to access the chart detail. To see your full list of trend graphs, tap the Arrow icon |
|