Dashboard Portlets in NetSuite for Android
NetSuite for Android enables you to use all web dashboards. If you add portlets available in NetSuite for Android to any of your dashboards in a browser session, the portlets display on your corresponding mobile dashboard. See Dashboard Personalization.
To switch between dashboards, tap the name of the currently displayed dashboard, and then tap the dashboard you want to access from the list.
You can change the layout of your dashboard to fit your device. See Changing the Dashboard Layout in NetSuite for Android.
The following table lists portlets available with NetSuite for Android.
To add a portlet to My Dashboard, tap the Star icon.
|
Portlet Name |
Description |
Screenshot |
|---|---|---|
|
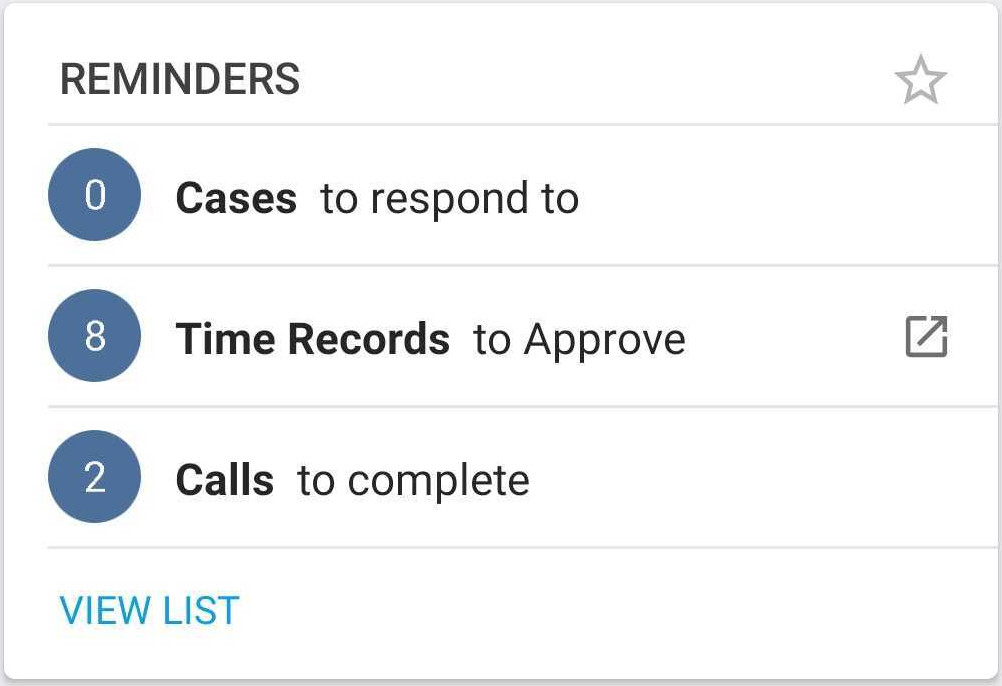
Reminders |
Displays the first three reminders you would see on your browser session dashboard. To see the full list of reminders, tap View List. All reminders based on a saved search display natively within the app. For example, Cases to respond to is a reminder based on a saved search. Reminders with a launch icon alongside them are not natively supported. In such cases, the app prompts you to view the results in a browser session. The system often includes launch icons for reminders that are generated by custom workflows. See Setting Up Reminders. |
|
|
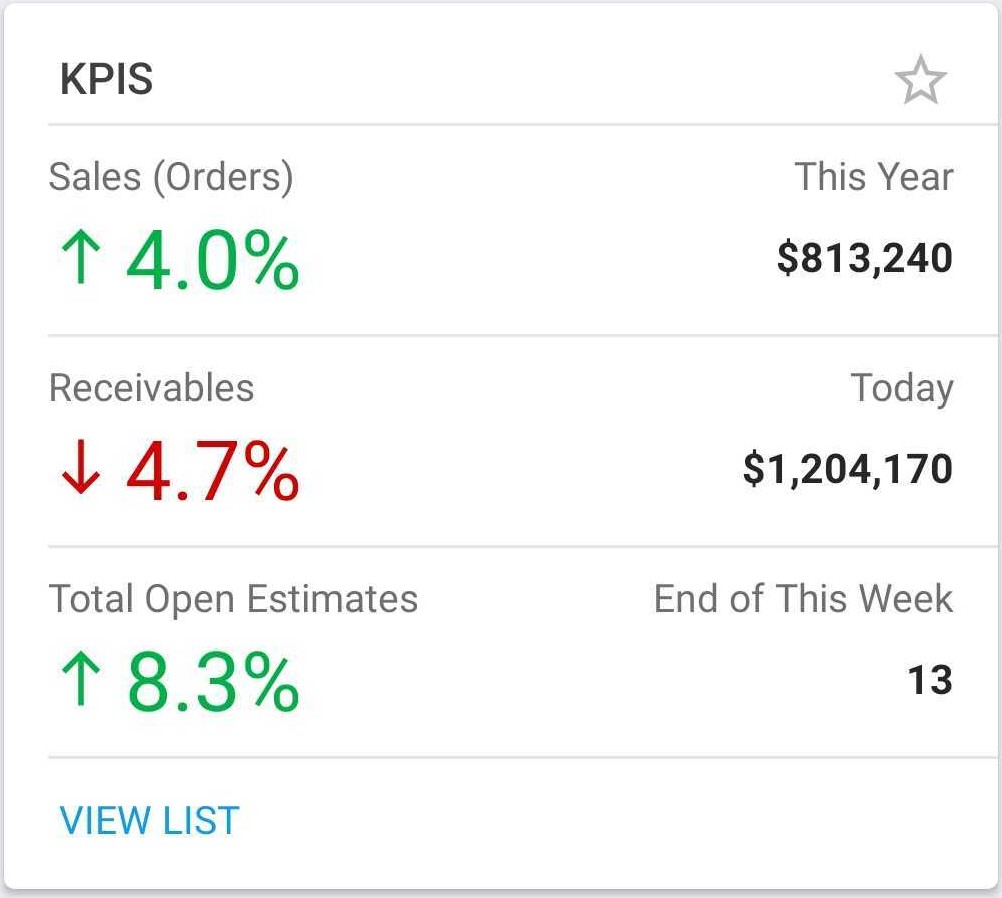
Key P |
The default behavior is to display the first three KPIs from your browser session Dashboard. If you have set up headline KPIs, their settings override this behavior, see Highlighting KPIs. Tap a KPI to access the chart detail. To see your full list of KPIs, tap View List. |
|
|
KPI Scorecard |
Displays KPI scorecards as configured on your browser session dashboard. To browse through your scorecards, swipe left or right. Tap a scorecard to access the chart detail. To see your full list of KPI Scorecards, tap View List. See Adding a KPI Scorecard Portlet to a Dashboard. |

|
|
KPI Meter |
Displays the first KPI Meter as configured on your browser session dashboard. Tap the KPI meter to display more details in the portlet. To browse through your KPI meters, swipe left or right. See KPI Meters. |

|
|
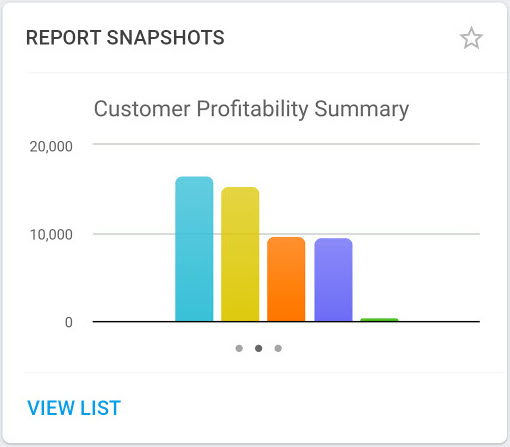
Report Snapshots |
Displays the first report snapshot as configured on your browser session dashboard. To browse through your report snapshots, swipe left or right. Tap a report snapshot to access the chart detail. To see your full list of report snapshots, tap View List. To display report snapshots on your app, make sure that the Display Type is set to Graph in the portlet set-up options in your browser session. See Setting Up a Report Snapshot Portlet. |
|
|
Custom Searches |
Displays the first three custom search portlets from your browser session dashboard. Tap a custom search to access it. To see your full list of custom searches, tap View List. See Displaying Saved Search Results in Dashboard Portlets. |

|
|
Trend Graphs |
The portlet displays the first trend graph from your browser session dashboard. To browse through your trend graphs, swipe left or right. Tap a trend graph to access the chart detail. To see your full list of trend graphs, tap View List. See Setting Up Trend Graph Portlets. |

|