Track the Status of Integration Instances
You can track fields in messages on which you have defined business identifiers on the Instances page during runtime. These fields are available for tracking on the Instances page because you defined at least one business identifier in the Business Identifiers panel during design time.
- In the navigation pane, click Observability, then Instances.
- Perform the following tasks:
- View the Slowest Running Activities in an Integration Instance
- Discard an Instance on the Instances Page
- View the Status of Future Schedule Integrations
- View the Activity Stream on the Instances Page
- View the Child Instances of a Parent Instance
- View the Activity Stream of a Child Integration Separately from the Parent Integration
- View the Display of HTTP Headers Separate from the Payload
- View File Metadata for Large Payloads in the Activity Stream
- View the Activity Stream for Adapters Created with the Rapid Adapter Builder
You can also view the activity stream, business identifiers and values, and message payload in failed instances. See Manage Errors.
View the Slowest Running Activities in an Integration Instance
To diagnose performance issues, you can view the activities in the activity stream by their elapsed time. This ability ensures that the most time-consuming activities show first in the list and the best performing activities appear at the bottom. This functionality provides you with an immediate performance view and eliminates the time-consuming task of clicking each individual message or a large number of iterations in a looping action to identify time-consuming activities.
- The duration is not shown for all activities. The duration for an activity is the time from the beginning to the end of activity execution. Not all activities have both times (for example, a trigger or a throw action) because both are not applicable.
- The duration may not be available even for activities that have both times (such as a map action). This is because availability of these times depends on the integration tracing level. For example, an invoke action always appears, but other actions appear only when the instance is executed with the tracing level set to debug.
- Only the top 10 slowest activities are shown in the table. Your integration may have many more actions.
- You can view the overall time a looping action (for example, a
while action or a for-each action) took to execute all its iterations. You
can also expand the looping action to view the following:
- If your looping action had less than 10 iterations, all iterations and their times to execute are shown.
- If your looping action has more than 10 iterations, only the ten slowest iterations and their times to execute are shown.
- Go to the row of the integration instance to view. The Duration column shows the time that an instance took to execute.
- Click View Details
 .
.
The activity stream is displayed.
- Click View slowest activities
 .
.
The total duration of the instance is displayed at the top. The activities that took the longest amount of time to execute are displayed in a table. The final column shows the percentage of time each activity took to execute based on the total duration of the instance. For this example, getWeatherInfo included a looping action that iterated 13 times.
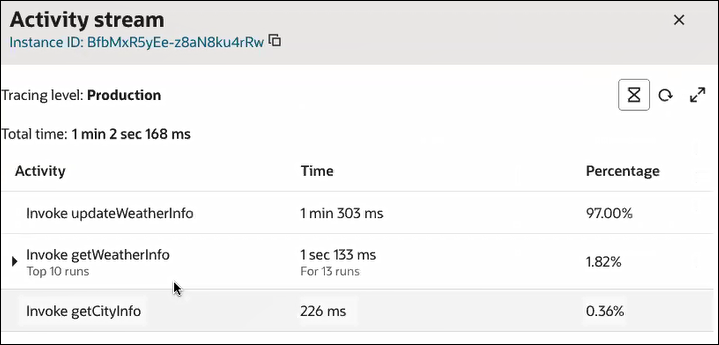
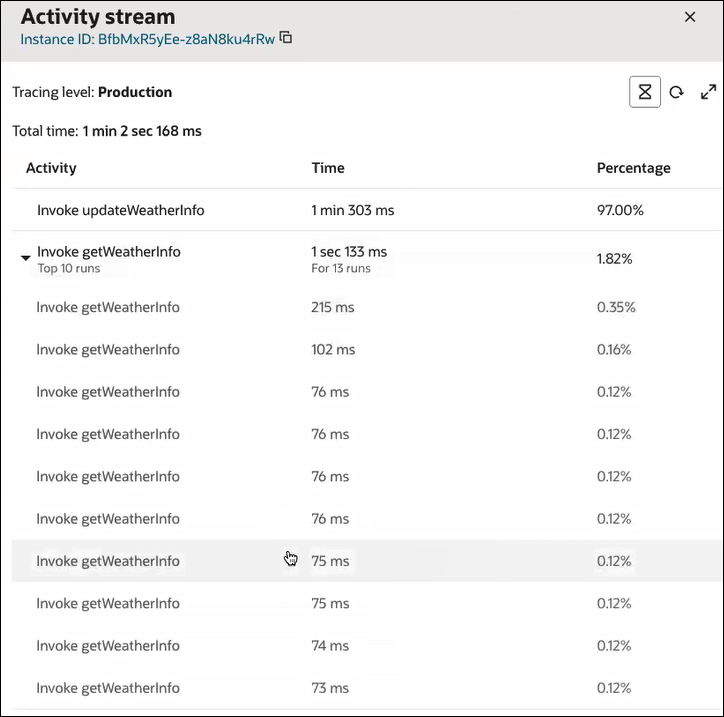
- Expand the looping action (getWeatherInfo) to
view the iterations. For this example, the looping action was executed 13 times.
The 10 slowest-running iterations are shown.
- Use this functionality to identify and debug slow running activities.
- Click View slowest activities
 again to return to the activity stream. This link enables you to toggle
back and forth.
Discard an Instance on the Instances Page
- Hover over the row of the instance to discard, then select
Abort
 .
.

This option is only visible under the following scenarios:- In-progress instances of asynchronous integrations (both scheduled and nonscheduled).
- Waiting and paused instances of schedule integrations. Attempting to discard other types of instances results in an error message being displayed.
View the Status of Future Schedule Integrations
Schedule integrations that have not yet run are displayed as Queued on the Instances page. The Duration column shows the label Scheduled on and the time at which the queued integration is scheduled to run (for this example, in four minutes).

- Hover over the queued integration in the Duration column to display the full date and time at which the queued integration is scheduled to run.
- Click View Details
 or click the business identifier in the Primary
Identifier column of a queued integration. The Activity Stream
panel opens in either place and shows the time at which the queued integration
is scheduled to run.

View the Activity Stream on the Instances Page
- Hover over an instance, then select View Details
 to view the activity stream of the instance.
The activity stream shows details about the movement of the message through the integration, including where any failures occurred. The message flow through each action is also shown.
- Expand the invoke connection.
Key child messages of the parent invoke connection are displayed.
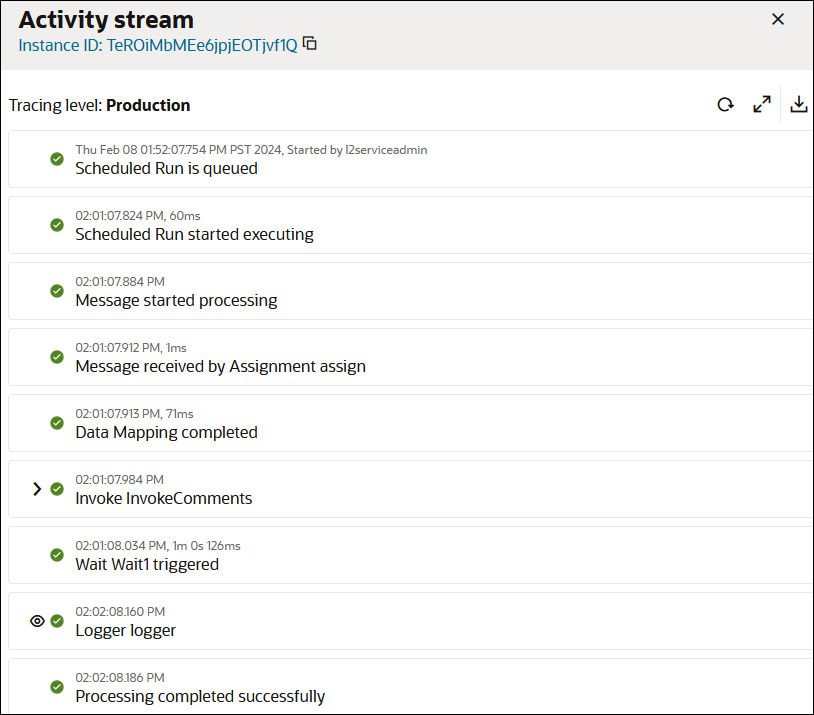
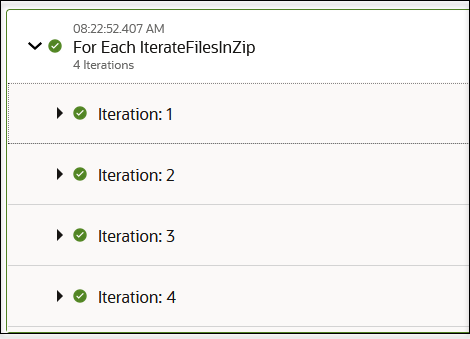
The date and time according to your user preferences are displayed. If your instance contains logic actions (for example, a while action or a for-each action with multiple iterations), each iteration is shown in the activity stream and can be expanded to show specific details about the message flow.
- Click Download
 at the top of the activity stream to download the activity stream logs
for the entire instance.
- Click View Payload
 to view the payload for that part of the integration flow.
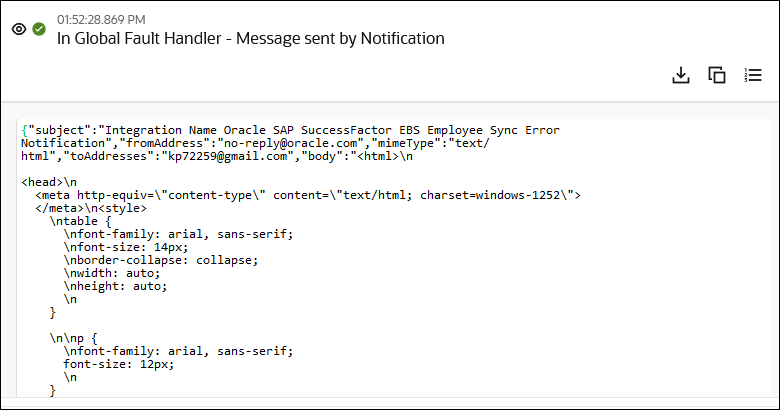
If you view the message payload data in the activity stream of an integration instance in which the tracing level is set to debug or audit, then the time, your user name, and a message indicating that you viewed message payload data are written to the audit log. If the tracing level is set to production, your user name is not logged to the audit log because message payload data is not visible.
- Perform tasks within the payload.
Element Description Summary Click to view a summary of payload details. Details Click to view more specific payload details. Download Payload 
Click to download this part of the payload to your desktop. Copy Payload 
Click to copy this part of the payload for pasting into a document. Toggle Line Numbers 
Click to show or hide line numbers in the payload.
View the Child Instances of a Parent Instance
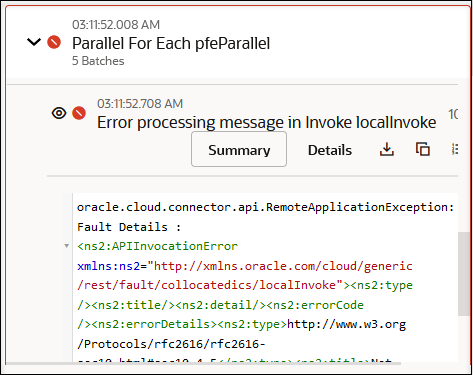
If your instance invokes child instances (for example, an integration action in your flow is invoking child integrations), you can view those instances on the Instances page.
- Hover over a row and select View Child
Instances.

You can also view invocations of child instances (local invokes) in the activity stream.
View the Activity Stream of a Child Integration Separately from the Parent Integration
You can view a child integration being invoked by a parent integration
in a separate activity stream. You can also view the separate activity streams for
one integration that invokes another integration, which then invokes a child
integration. Each activity stream is connected by a ![]() button that provides easy access.
button that provides easy access.
See Invoke a Child Integration from a Parent Integration.
- Hover over the instance of a parent integration that invokes a child integration.
- Click View Details
 .
.
The activity stream is displayed.
- Expand the invoke connection.
The View child instance details link is displayed. This is where the instance of the child integration is invoked.
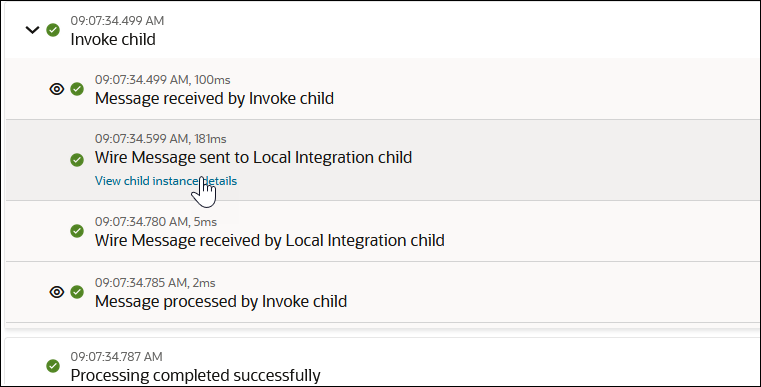
- Click View child instance details to access
the instance of the activity stream for the child integration. Note that
Integration: Child and the integration version number
are also displayed after the instance ID at the top.
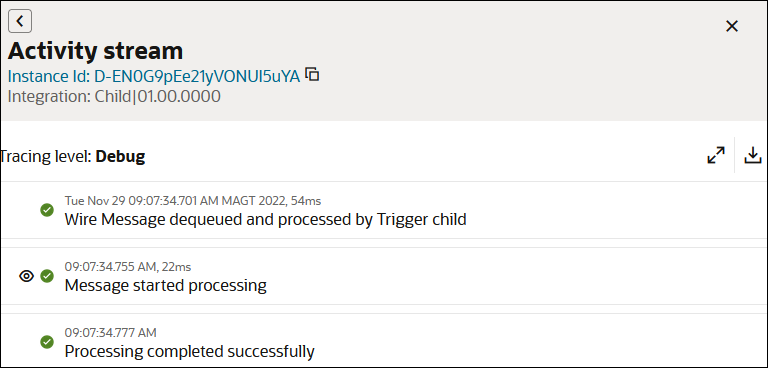
- Click
 to return to the instance of the activity stream for the parent
integration.
- Return to the Instances page and hover over the instance of an integration that invokes another integration, which then invokes a child integration.
- Click View Details
 .
.
- Expand the invoke connection.
- Click View child instance details to access
the instance of the activity stream for the integration being invoked.
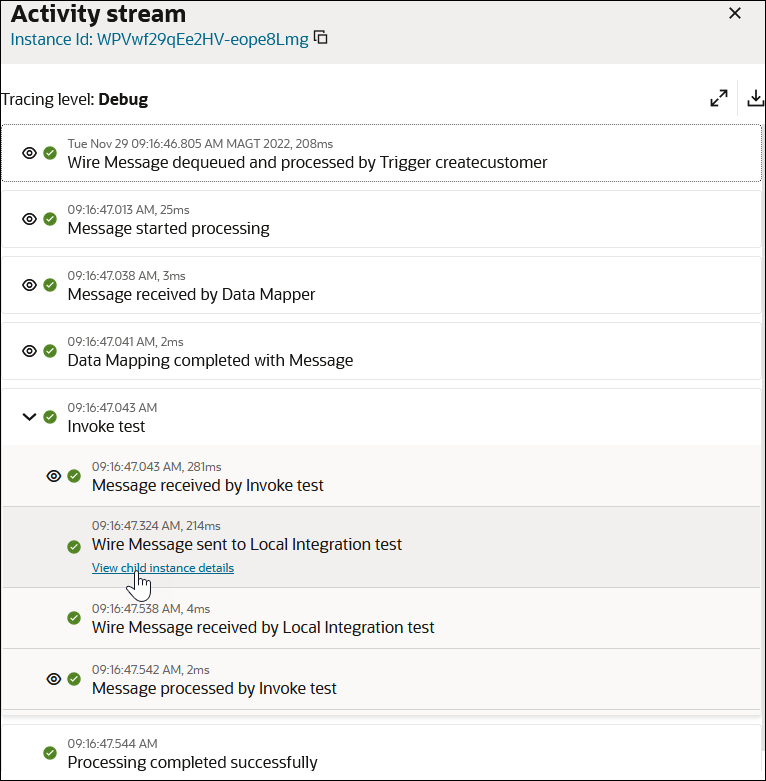
Note that the parent name and the integration version number are displayed at the top.
- Expand the invoke connection.
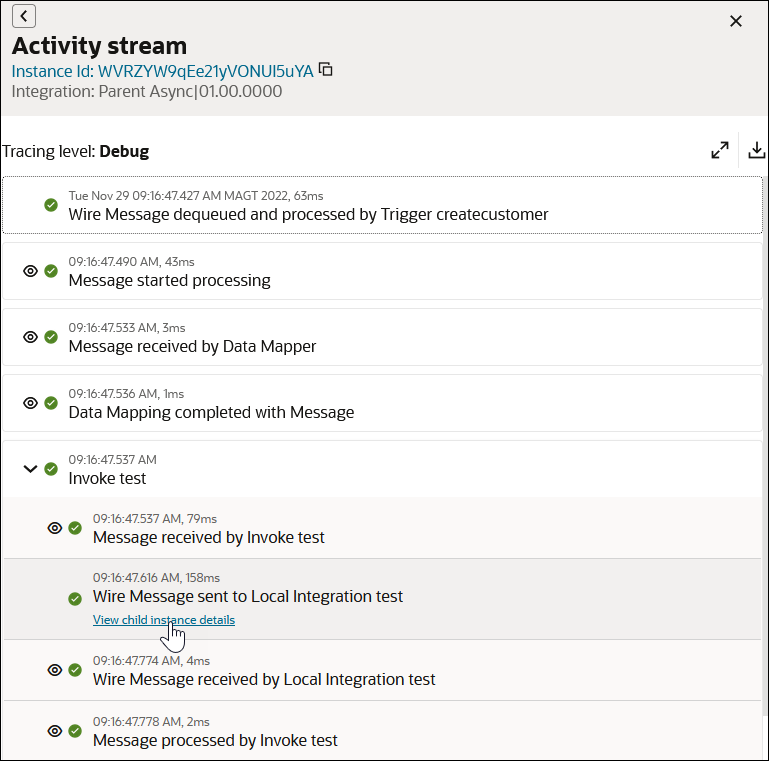
- Click View child instance details to access
the instance of the activity stream for the child integration being invoked.
Note that the child name and the integration version number are displayed at the top.
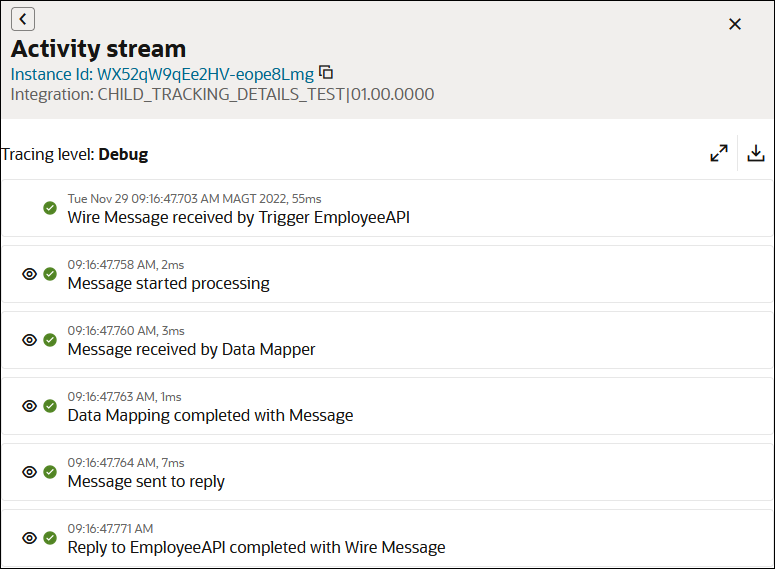
- Click
 twice to return to the instance of the activity stream for the top
level integration.
View the Display of HTTP Headers Separate from the Payload
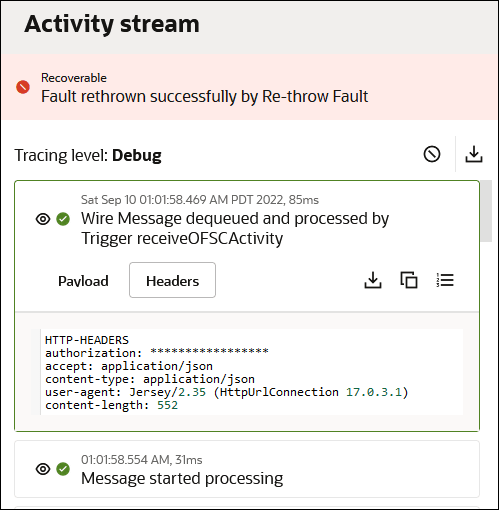
HTTP headers associated with a payload are displayed separately from the payload for ease of viewing in the activity stream.
- Click View Details
 .
.
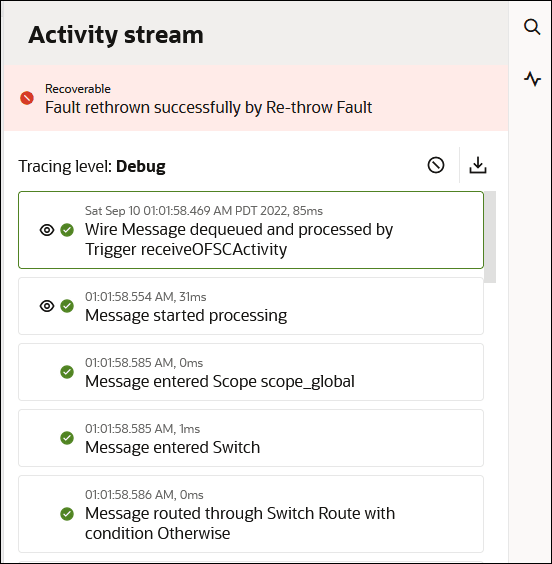
If HTTP headers are associated with the payload, two tabs are displayed: Payload and Headers.
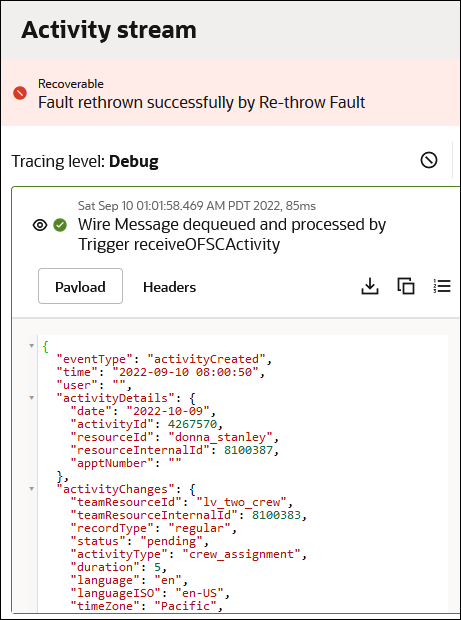
- Click Headers to view details about the HTTP headers
associated with the payload.
View File Metadata for Large Payloads in the Activity Stream
You can view file metadata for large payloads in the activity stream.
For example, if an integration performing inbound polling sends a CXML payload in GZIP format, the payload is shown in readable format in the activity stream. The payload size and media type are also shown.
View the Activity Stream for Adapters Created with the Rapid Adapter Builder
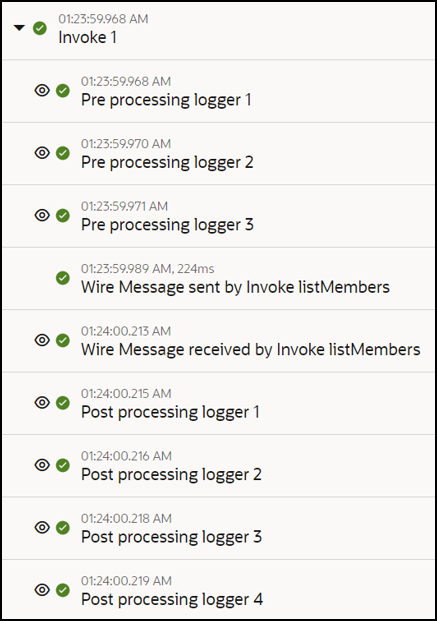
When the tracing level is set to Debug, you can view messages for the top level invoke connection and any invoke connections it calls. You can expand each invoke connection being called to view messages for preprocessing logs, wire messages, and postprocessing logs.
- Click View Details
 for an instance that includes an adapter created with the Rapid Adapter
Builder.
- View the activity stream and note that a single invoke connection
(listMembers) for an adapter created with the Rapid
Adapter Builder is calling multiple invoke connections.
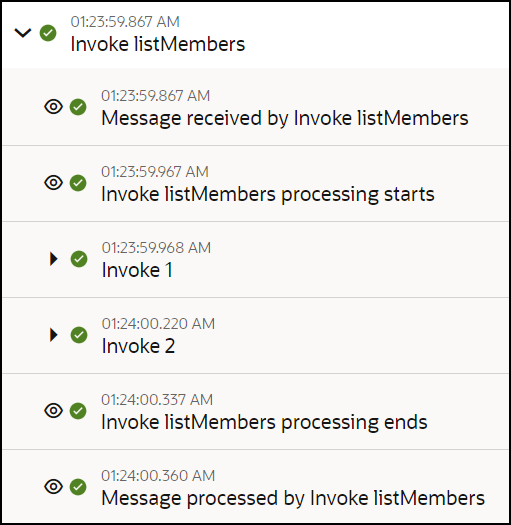
- Expand an invoke. Each invoke can have preprocessing and
postprocessing loggers before and after the invocation. Wire messages sent and
received by listMembers are also shown.
- Click View Details
 to view details about the payload and the messages being logged.