Understanding Enterprise Process User Interface
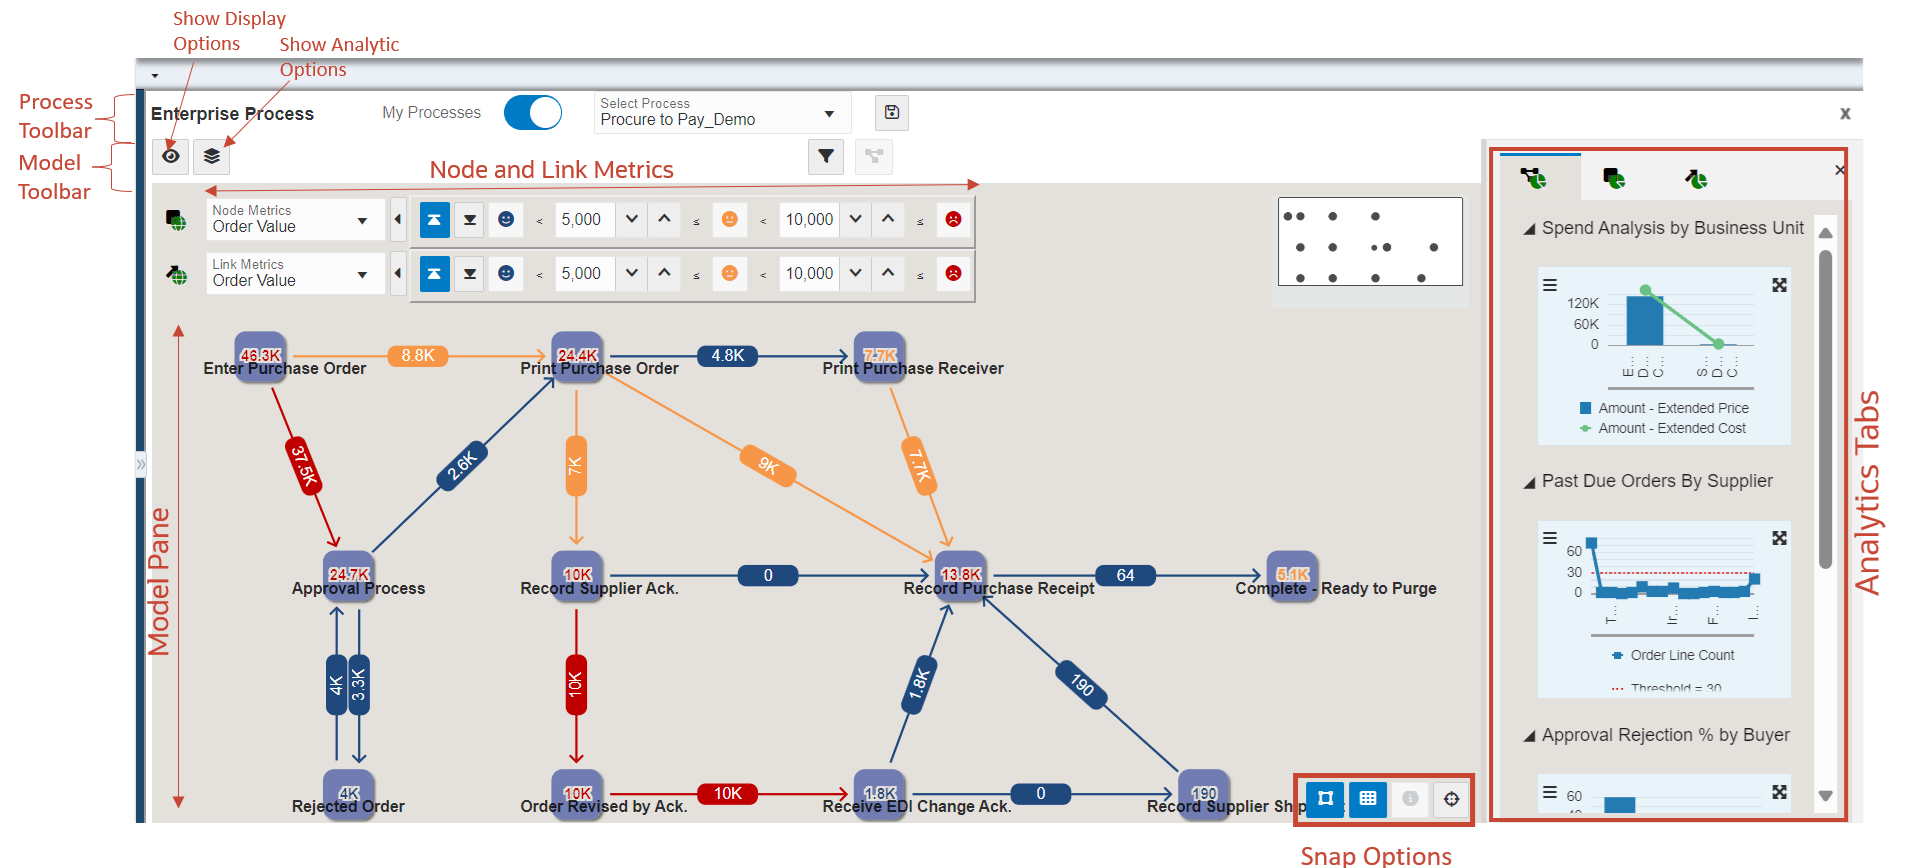
The Enterprise Process (runtime mode) window displays the enterprise process diagram generated using the template you select while creating the process. This window contains the following user interface elements: process toolbar, model toolbar, model pane, node and link metrics, analytics tabs and so on.
The window displays icons for filtering and refining the data displayed on the enterprise process diagram and analytics tabs. You can hover your mouse over the icons and tabs to view the label of the component.
Using the Enterprise Process window, you can make changes to the filters and analyze your process. See, Analyzing an Enterprise Process.
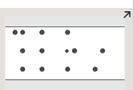
The model pane displays a mini map of the process diagram in the right upper corner, indicating the nodes' positions. (Tools Release 9.2.9.3) You can hide or unhide this map using the Hide Mini Map and Show Mini Map icons.
.
Process Toolbar
- My Processes: Enabled by default.
- Process Selector: This drop-down list contains the list of available enterprise process UDOs.
- Snapshot

- Exit Runtime: Closes the runtime Enterprise Process window.
Model Toolbar
The model toolbar contains the following icons and options:
-
Show Display Options

When you click this icon, the system displays a left pane with display options. You can click the Hide View Options (X) icon to close this pane.
-
Show Analytics Options

When you click this icon, the system displays a left pane with analytics options. You can click the Hide View Options (X) icon to close this pane.
-
Show Filter Options

When you click this icon, the system displays a top pane (on top of the model pane) with filter options. You can click the Hide Filter Options (X) icon to close this pane.
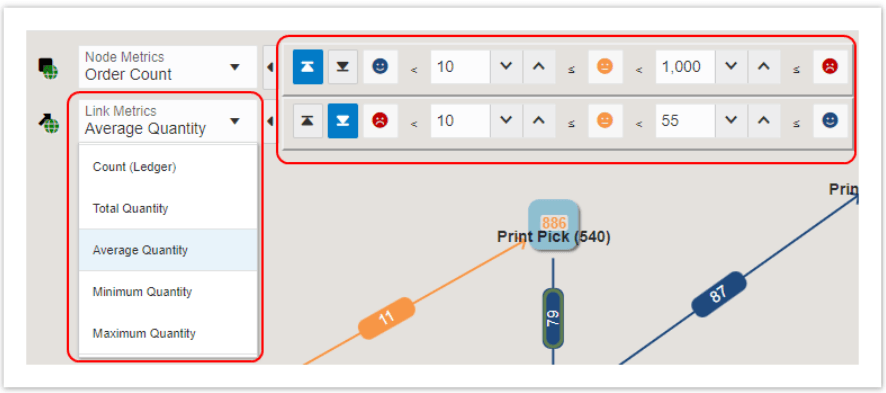
Model Pane
In the model pane, you can select values and configure threshold values using the Node Metrics and Link Metrics fields. The threshold is associated with individual metrics (for both Node and Link metrics).
Starting with Tools Release 9.2.9.3, if a template includes a connected template, you can preview both the parent and the child processes. In this case, the system displays the Hierarchy Map window showing the hierarchy between the processes.
(Tools Release 9.2.9.3) The system displays a loop around the node in the design mode if an activity rule involves a self-referential loop (for example, transitioning from the 400 status back to the 400 status within the activity rules). In the Preview tab, the self-referential loop displays the appropriate metric values depending on the options defined in the Show Display Options and Show Filter Options windows.
You can drag and drop the nodes to the desired location, and use the Snap to Grid  , Snap to Node
  , and Zoom to Fit
 icons to make changes to your layout. You can hold down the Ctrl key when
dragging and dropping a node to disable Snap to Grid and Snap to Node features
temporarily.
icons to make changes to your layout. You can hold down the Ctrl key when
dragging and dropping a node to disable Snap to Grid and Snap to Node features
temporarily.
The tabs at the right display the graphs to view analytical details of the enterprise
process diagram, and you can refine the data displayed on the graphs by using the
Configure icon on each graph. You can also hide and unhide the analytics tabs by using
the Hide Context Analytics
icon on each graph. You can also hide and unhide the analytics tabs by using
the Hide Context Analytics 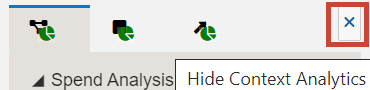 and Show Context Analytics
  icons. You can click the arrow icons to collapse or expand the individual graphs
in the analytics tabs. Also, you can click the Maximize
icons. You can click the arrow icons to collapse or expand the individual graphs
in the analytics tabs. Also, you can click the Maximize or Minimize
  icons on the graphs to view them in maximized or minimized modes.
The system displays the Click to set the context to the process level icon when the Node Analytics and Link Analytics tabs are displayed. You can click
this icon to view the Process Analytics tab.
when the Node Analytics and Link Analytics tabs are displayed. You can click
this icon to view the Process Analytics tab.
You can show or hide all the panes: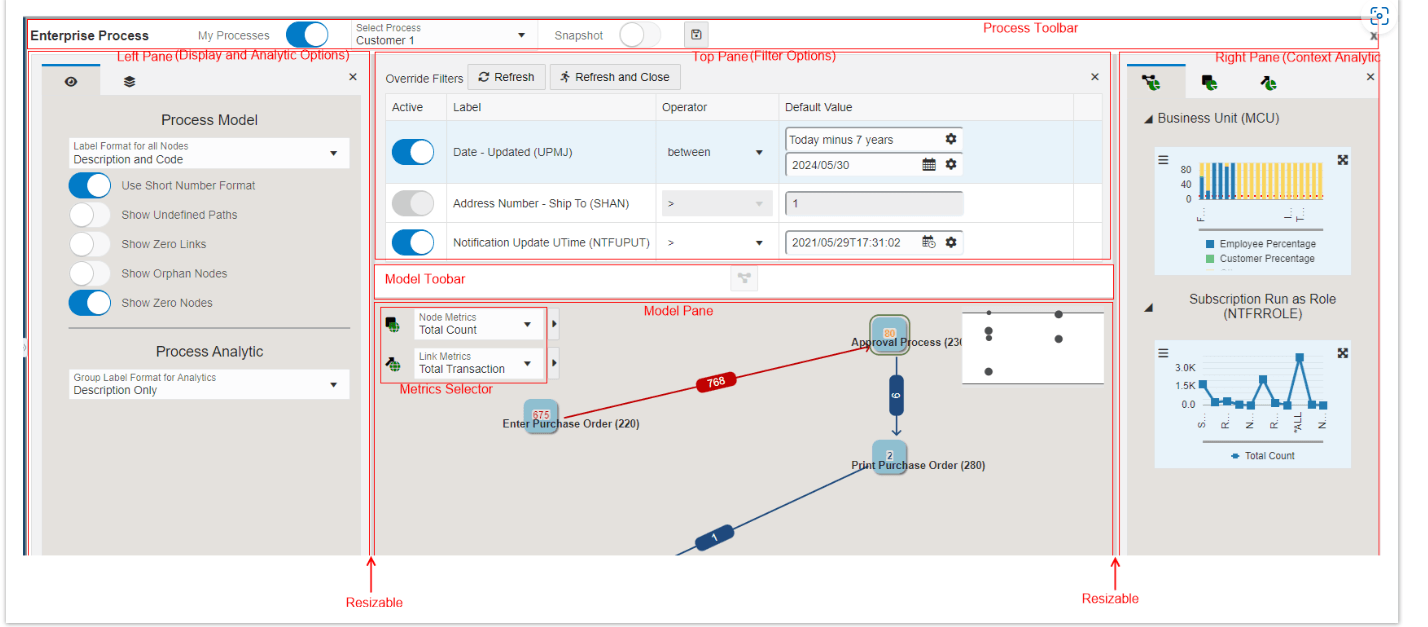
Between the left pane (displayed when you click Show Display Options or Show Analytic Options), model pane, and analytics pane, there is a resize area, which is highlighted when you hover over with your mouse cursor. You can drag it left or right to resize the panes.