Analyzing an Enterprise Process
You can view and analyze the enterprise processes by using the Enterprise Process Modeler in the runtime mode. This mode enables you to choose from a set of user generated enterprise process UDOs, visualize a graphic of the process model, visualize KPIs, metrics and measurements that apply to nodes and connections within the process model, and other functions.
To analyze an enterprise process:
- Access the JD Edwards EnterpriseOne application.
From the User menu, click Enterprise Processes.
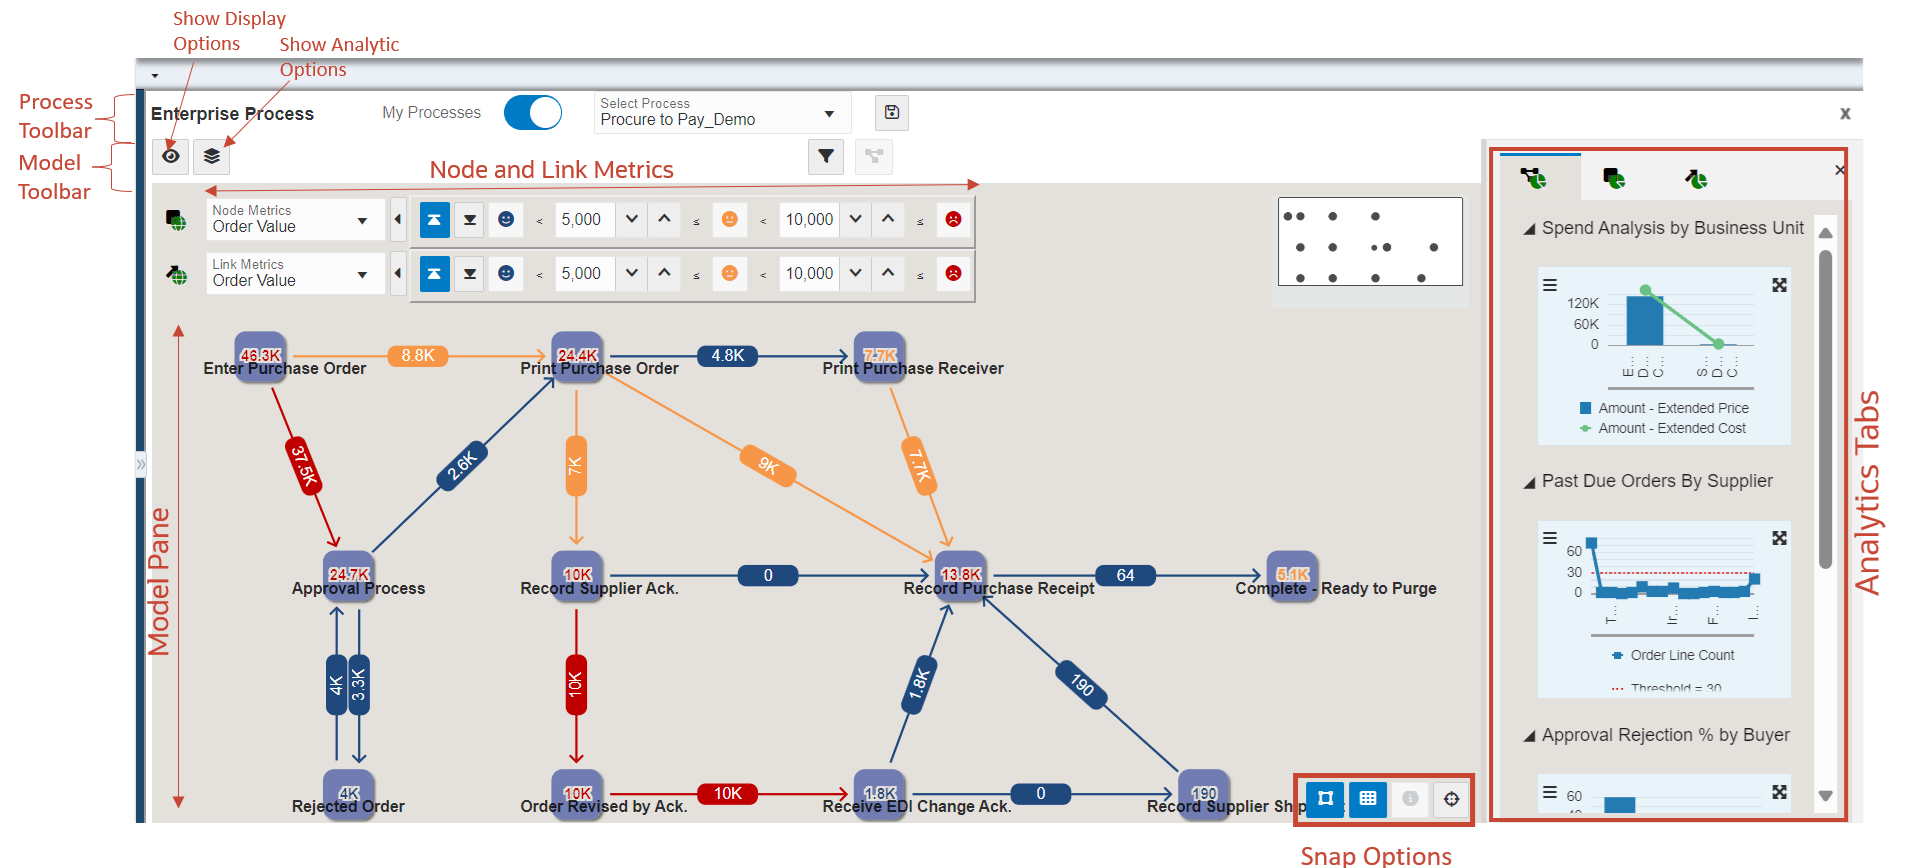
The Enterprise Process window is displayed along with the enterprise process diagram of the process displayed in the Select Process drop-down list. You can also see that the Enterprise Process is now added to the Open Applications carousel.
Note: The Enterprise Processes link is only displayed if you have at least one enterprise process UDO object (either personal or with view access to a shared UDO). Also, the Enterprise Process must be active in Feature Security. See Managing UDO Feature Security.Note: You can open any application and toggle between the application window and the Enterprise Process window. Both the default and large carousel icons (set in the Preferences window) will work as expected when the carousel is positioned in four different places.The following screenshot shows an example enterprise process in the Enterprise Process window. The window contains the following user interface elements: process toolbar, model toolbar, model pane, node and link metrics, analytics tabs, and so on. See, Understanding Enterprise Process User Interface.
-
You can drag and drop the nodes to change their positions. You can use the Snap to Node, Snap to Grid, and Zoom to Fit options to make changes to the layout of the enterprise process diagram.
- You can make these changes using the process toolbar.
- The My Processes option is enabled by default and the processes selected in
the Select My Processes window are displayed in the Select Process drop-down
list. See Selecting My
Processes.
You can disable the My Processes option to see all the personal and shared enterprise process UDOs in the Select Process drop-down list.
Note: The system displays a black dot icon next to the process names that are saved as Personal UDOs in the Select Processes drop-down list when My Processes is enabled. - Select the required process from the Select Process drop-down list. The system displays the runtime view of the selected process.
- Click the Save As Snapshot icon to save the enterprise process as a snapshot. See, Analyzing Snapshot.
- The My Processes option is enabled by default and the processes selected in
the Select My Processes window are displayed in the Select Process drop-down
list. See Selecting My
Processes.
- Starting with Tools Release 9.2.9.3, if a template includes a connected template, you can analyze both the parent and the child processes using the Enterprise Process window. In this case, the system displays the Hierarchy Map window showing the hierarchy between the processes in the Enterprise Process window. You can drag and drop this window to resize it. You can also use the Show Hierarchy Window icon
 or Hide Hierarchy Window icon as per your preference.Note: The color themes for the parent and child templates can be selected while creating the template.
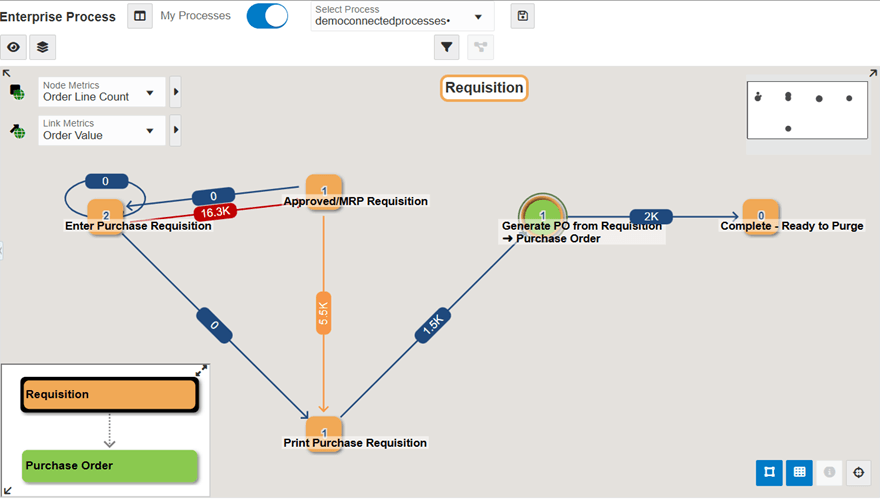
In the following example, the parent and child processes are displayed based on the selected color themes. The connected child process is indicated by a circular node in green (Purchase Order). You can right-click this node and click Drill into Connected Process to open the child process window.
In the heirarchy window, you can click Purchase Order (in green color) to view and analyze the child Purchase Order process and click Requisition (in orange color) to view and analyze the parent Requisition process. To indicate that the parent enterprise process is displayed, the system displays a dotted arrow to the child process. To indicate that the child process is displayed, the system displays a prominent arrow to the child process.
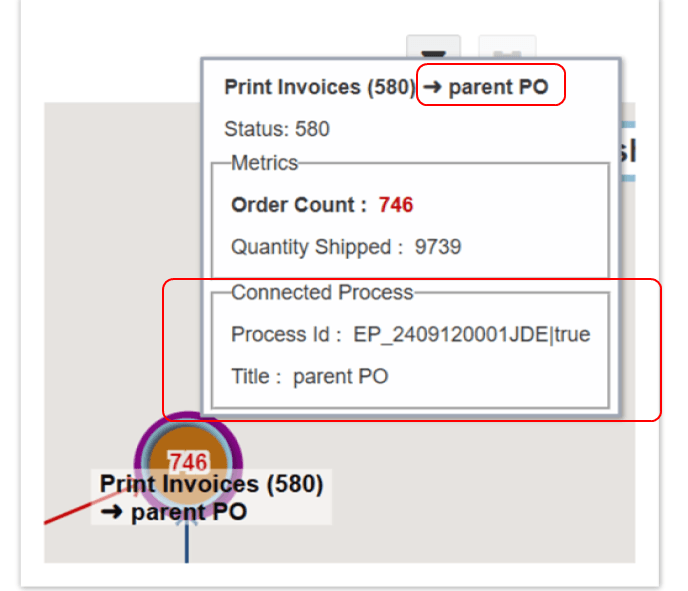
You can hover over the connected node to view information, such as the connected process, status code, and metric details on the hover form. On the hover form, the field selected in the Node Metrics drop-down list is displayed in bold, and its value is displayed in the threshold color.
In the following example screenshot, you can see the details of the connected process.
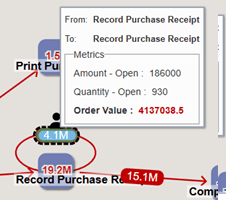
(Tools Release 9.2.9.3) You may see a loop around the node if an activity rule involves a self-referential loop (for example, transitioning from the 400 status back to the 400 status within the activity rules). The self-referential loop displays the appropriate metric values depending on the options defined in the Show Display Options and Show Filter Options windows. You can hover over the loop to view the From, To, and Metric details of the loop. When you click the loop, the system displays a People icon and a border to indicate that the link is selected. The system displays a dashed border (with a "marching ants" effect) around the link when you hover over a selected link. The corresponding analytics are displayed on the Link Analytics tab on the right.
- You can click the Exit Runtime icon to close the Enterprise Process window.
Proceed to the next sections to understand how to use the filter options available in the Enterprise Process window and analyze the enterprise process.