Margin Comparison Dashboard
The Margin Comparison dashboard enables you to compare the impact on margins of multiple cost strategies simultaneously, helping you identify and select the most profitable cost strategy.
Using the dashboard, you can:
- Compare margins derived from proposed new cost strategies as well as actual item costs and accounting.
- Make comparisons across different sales dimensions, including territory, customer, product, sales organization, and time.
- Evaluate impact of cost strategies on historical margins as well as unshipped (scheduled) and planned sales.
Prior to Release 12.2.15, you could evaluate the margin impact of just one cost strategy at a time using the Margin Analysis Dashboard.
Process Flow
Navigation:
- Cost Management - SLA / OPM Financials > Cost Management Command Center
- Cost Management - SLA / OPM Financials > Cost and Profitability Analysis
Step 1: Run Program: Margin Analysis Load Run.
The Margin Analysis Load Run program generates margin analysis data for sales order shipments and demand forecasts.
Step 2: Run Program: Cost Management Command Center Data Load
Submit the Cost Management Command Center Data Load program to load data from EBS to ECC.
Step 3: From a Cost Plan or Cost Simulation in the Cost and Profitability Analysis module:
Click Calculate Margins. This launches the Simulation Margin Load program that you can monitor in the Concurrent Requests tab of the Cost and Profitability Analysis page.
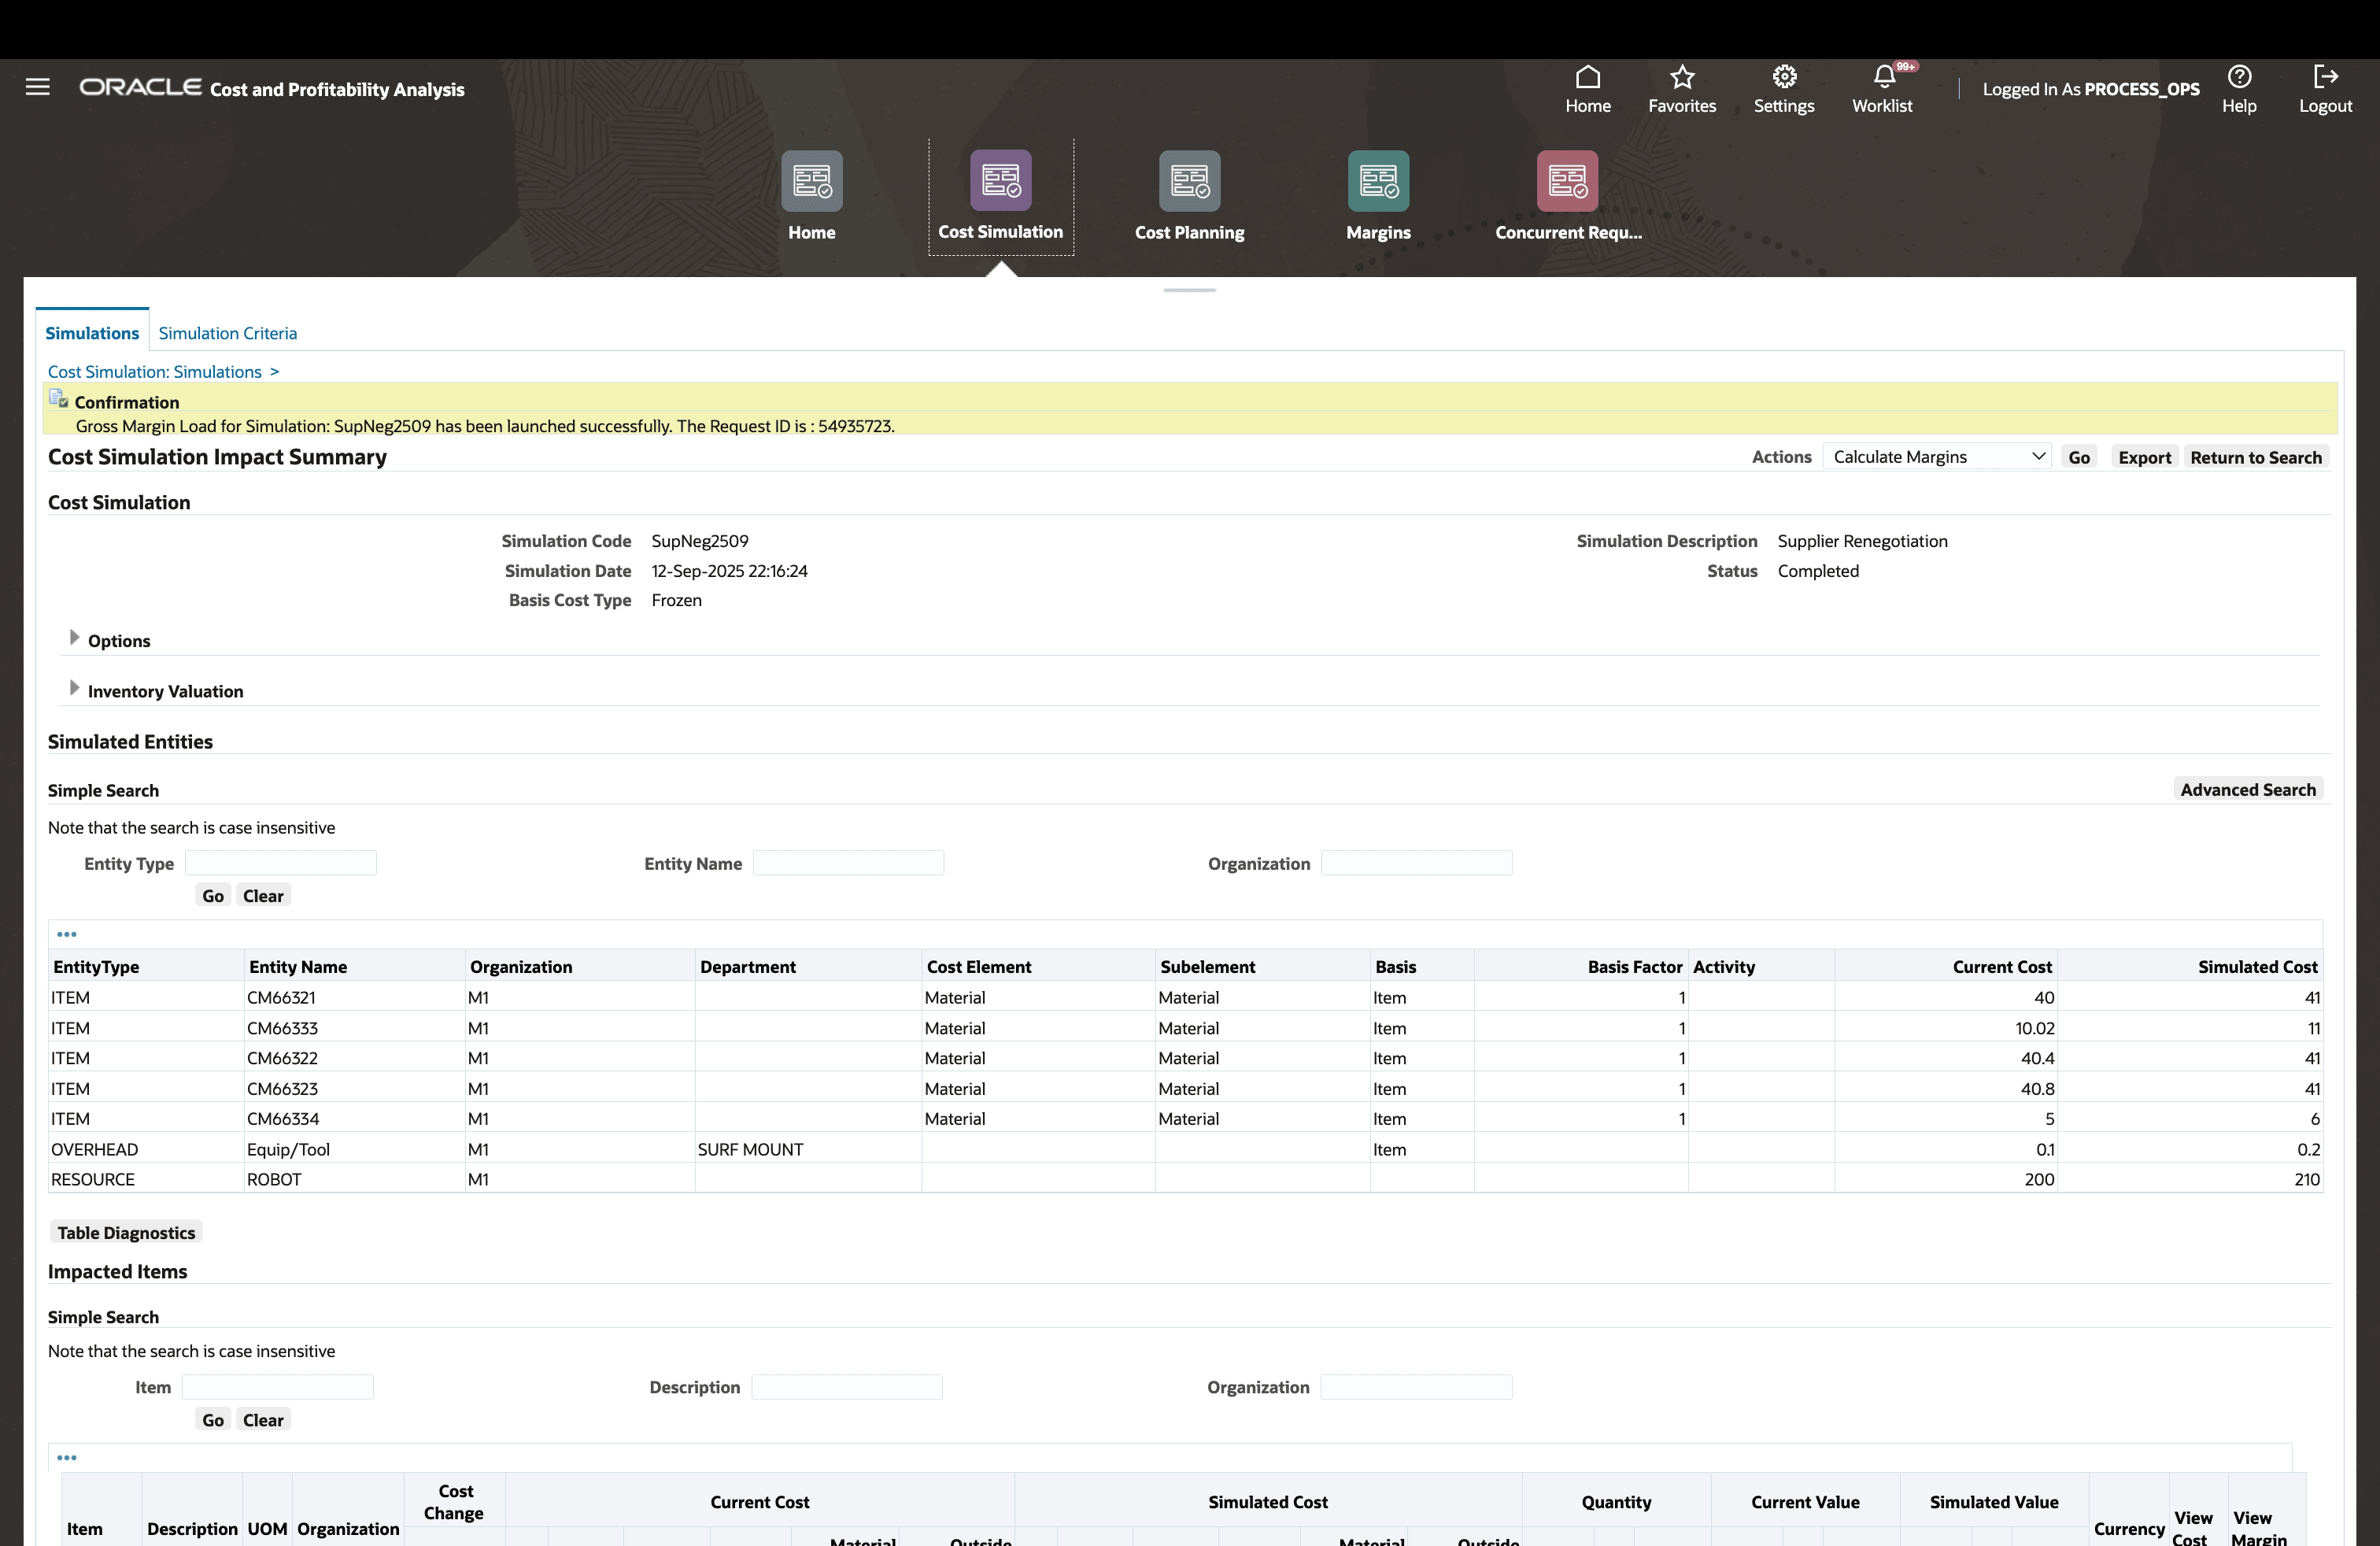
Calculate Margins for a Cost Simulation
- After margins have finished loading, click Analyze Margins
- You will be taken to the Margins tab > Margin Comparison Dashboard
- While the Margin Comparison Dashboard by default presents a comparison between actual margins and margins for simulations and cost plans, users can compare multiple cost strategies from both simulations and costs plans (as illustrated in following screenshots) to identify the most profitable cost strategy.
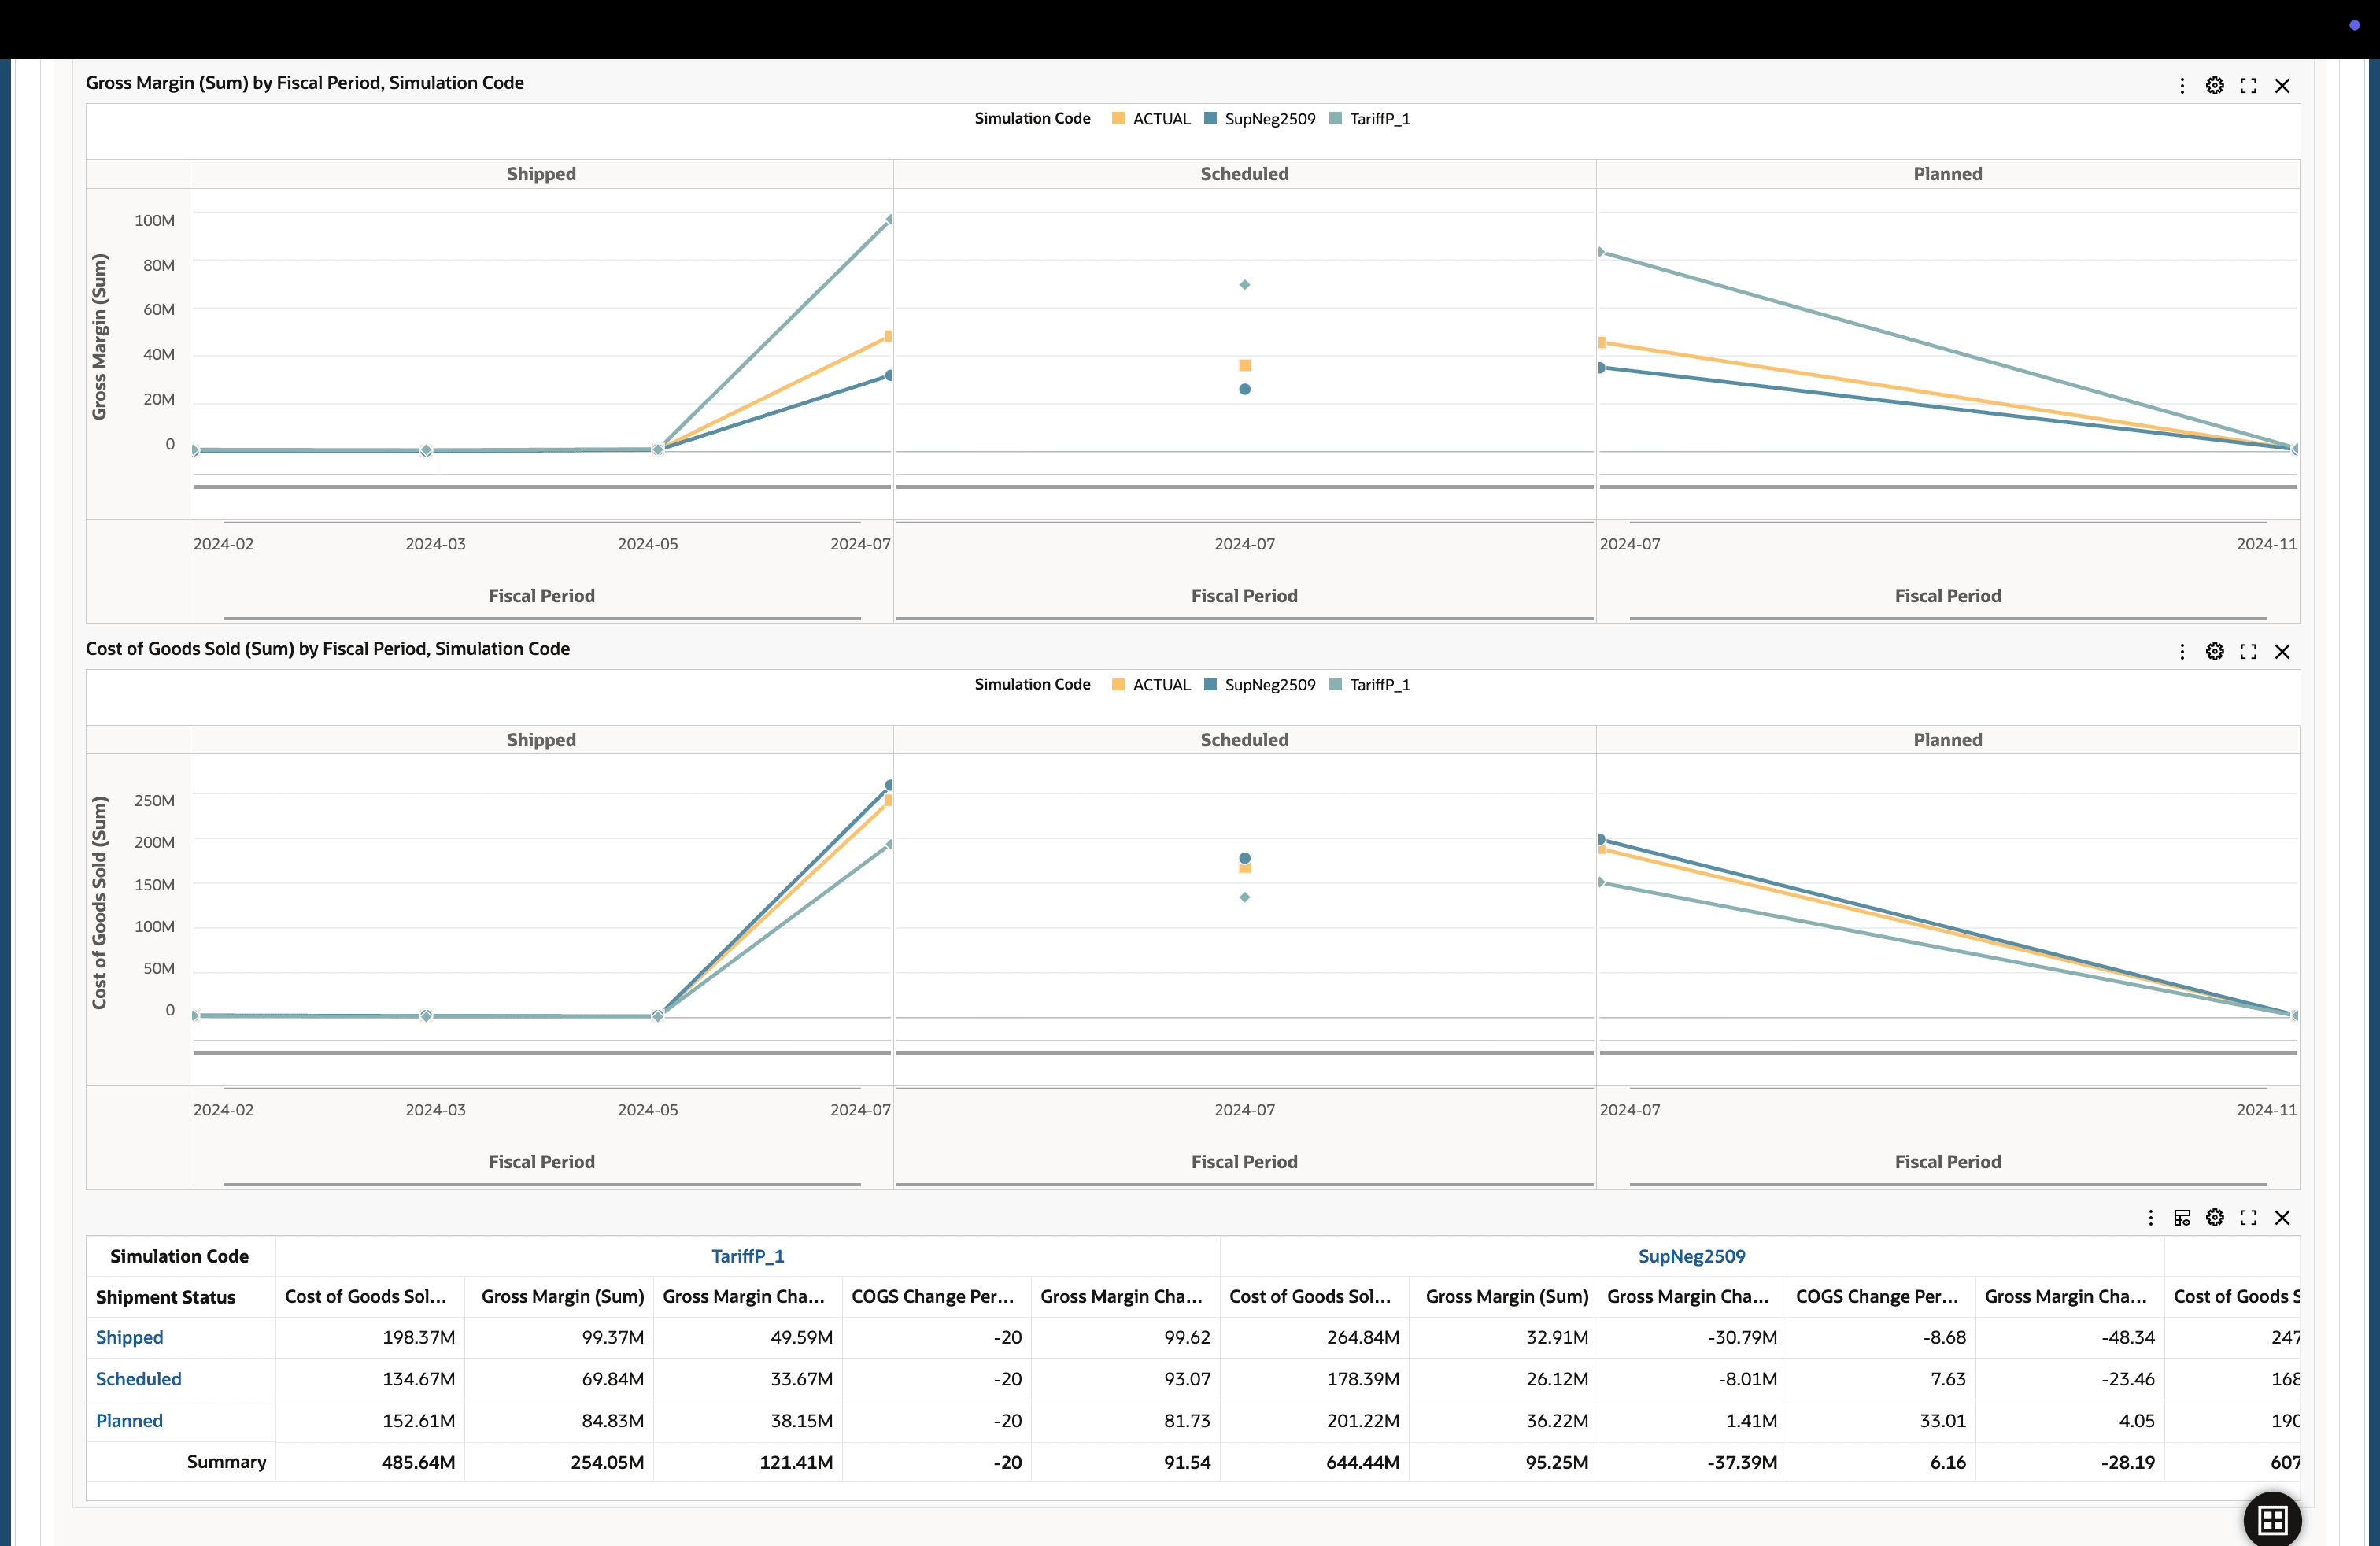
Margin Comparison Dashboard
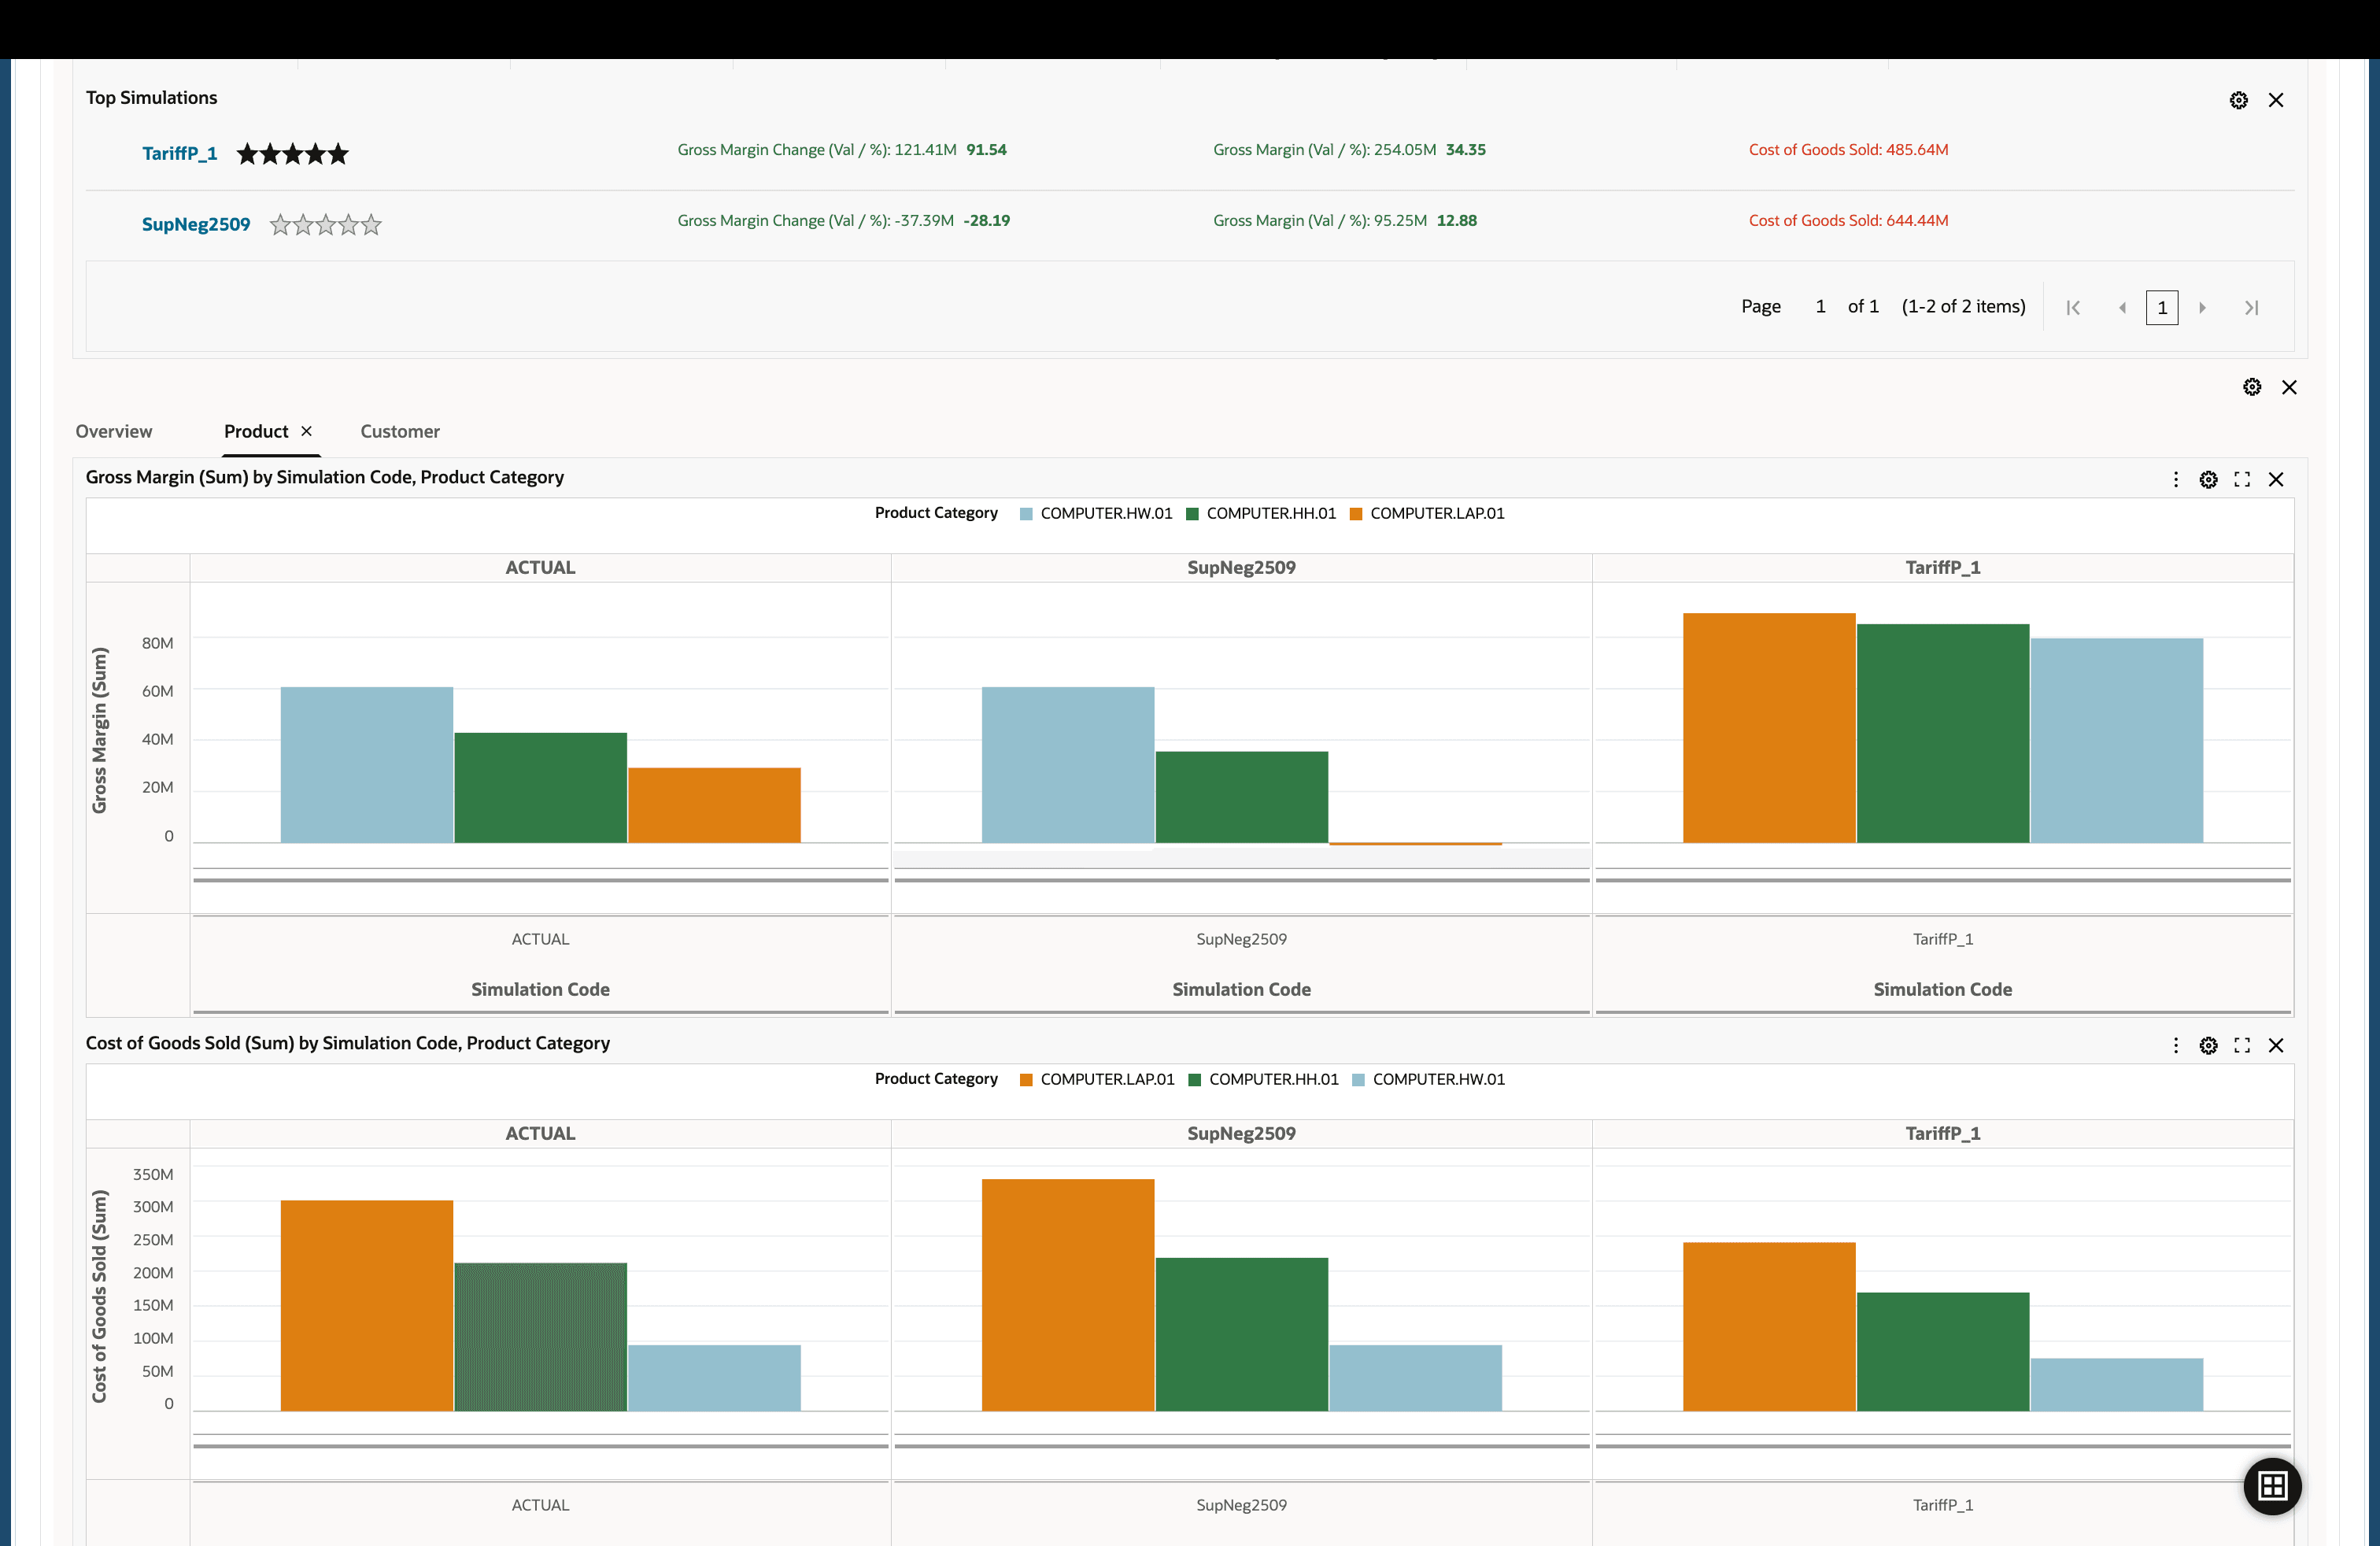
Margin Comparison Dashboard - Product Tab
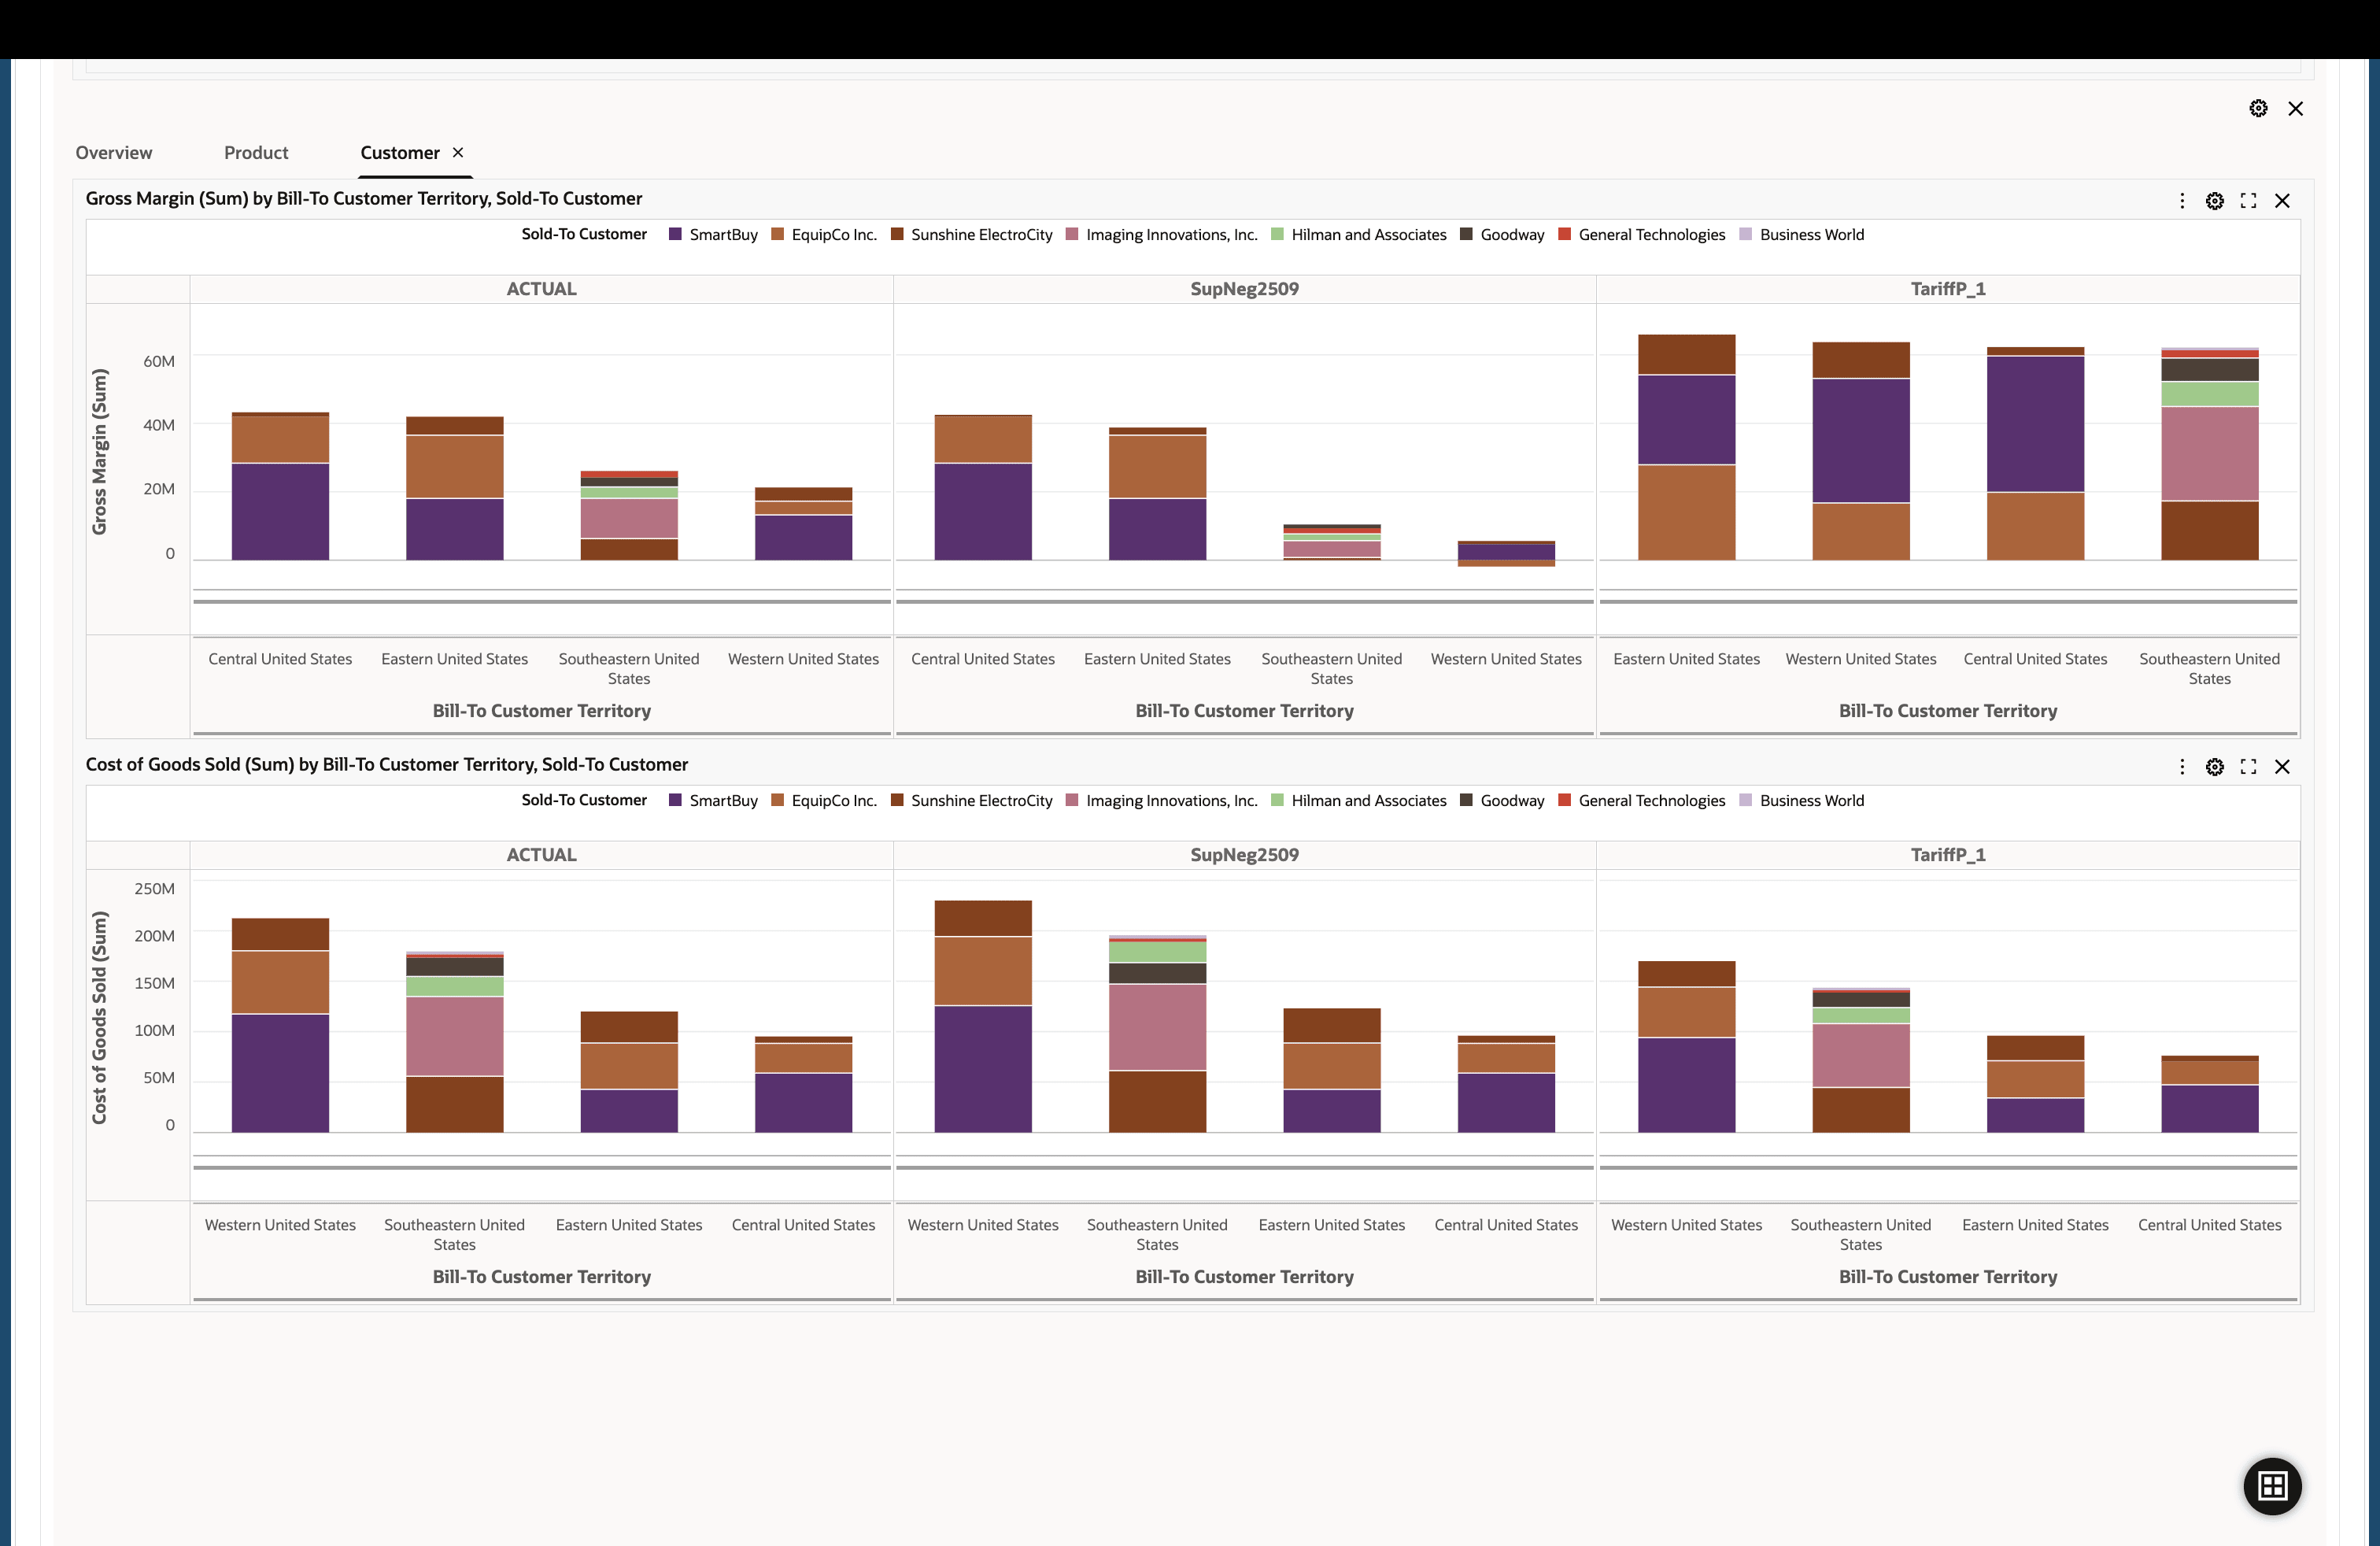
Margin Comparison Dashboard - Customer Tab
Steps to Enable
Users need the following two roles to access the Margin Comparison dashboard:
- Margin Analysis Access Role
- Cost Management Access Role
Tips And Considerations
- Access to margin analysis data in the dashboard is controlled by organization-level security controls.
- The Top Simulations section utilizes a default 5-star rating system to evaluate simulations. Users can extend the dashboard to customize the rating criteria according to their preferences. The current rating calculation is as follows:
- A decrease in margin receives 0 stars.
- A margin increase of 100% or more earns a 5-star rating.
- Improvements in between are assigned proportionate star ratings based on the percentage increase.
Key Resources
- Oracle E-Business Suite News and Information: oracle.com/ebs
- Oracle E-Business Suite Product Documentation: https://docs.oracle.com/cd/E26401_01/index.htm
- Oracle University: https://www.oracle.com/education
- Oracle Support: https://www.oracle.com/support