Adding Data Elements to Visualization Drop Targets
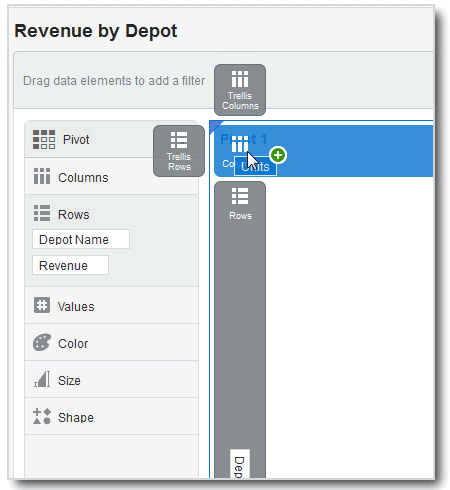
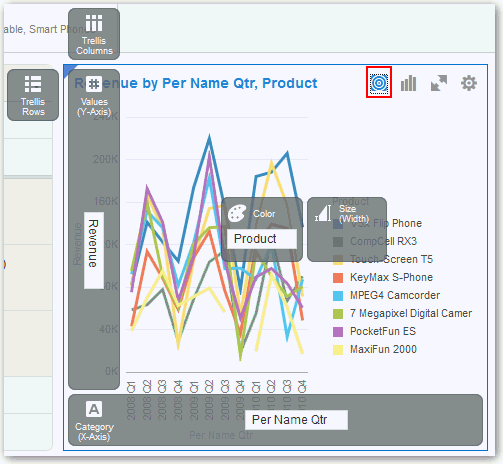
You can use visualization drop targets to help you position data elements in the optimal locations for exploring content.
To add data elements to visualization drop targets:
For more information on adding, removing, or moving data elements, see Adding Data Elements to Drop Targets.

