31 Troubleshooting Using System Tools
Topics:
31.1 Using the Configure Log ODL Tool
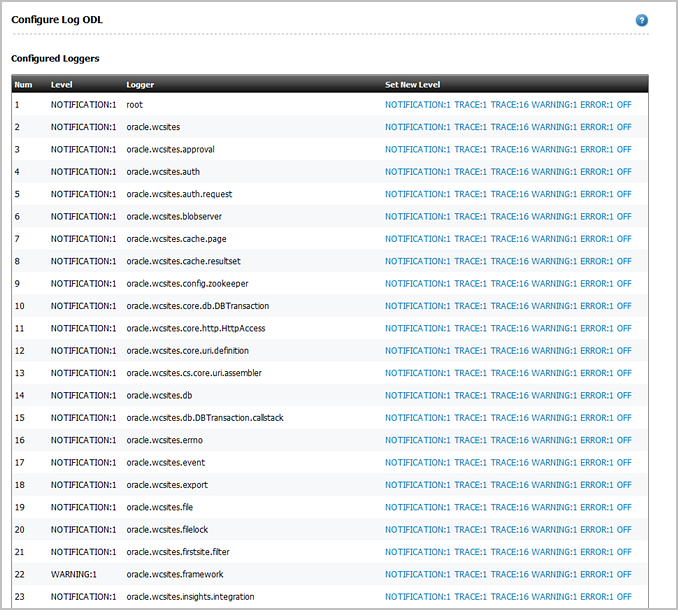
By default WebCenter Sites is set up to use the Oracle Diagnostic Logging (ODL) system. The Configure Log ODL tool enables you to view current logger levels, change logger levels, and add new loggers directly from the Admin interface. In addition, since changes to logger levels and added loggers remain in effect only until WebCenter Sites is restarted, you can retain your changes by manually adding new loggers to the logging-config.xml file.
The following topics provide information about using the Configure Log ODL tool in the Admin interface:
31.1.1 Viewing Loggers
You can view a list of WebCenter Sites loggers and their verbosity levels. The list includes the following:
-
Loggers that are registered in the
logging-config.xmlfile, in the<sites-shared>/configdirectory. The file is read only on system startup. If, during runtime, you make changes to thelogging-config.xmlfile and save them, your changes are not displayed in the Log ODL Configuration form. They are applied and displayed when WebCenter Sites is restarted. -
Loggers that are detected during runtime. The loggers are detected when:
-
System features or add-on components are accessed for the first time.
-
The loggers are added to the system manually by developers using the Add Logger feature, as shown in Adding New Loggers.
-
The collapsed view of the list shows the root logger and parent loggers, all of which are explicitly assigned verbosity levels. If you require a more granular view, you can expand the list to also show loggers that inherit levels from the root logger or parent loggers.
To view loggers:
31.1.2 Changing Logger Levels
You can temporarily change logger levels to define the type and number of statements that get written to the WebCenter Sites log specified in the logging-config.xml file. Your changes are applied right away; as soon as the loggers are executed, you can track the impact of their new levels in the log. The new levels remain in effect only until WebCenter Sites is restarted, but if you wish to retain the changes, you can change the logger value manually in the logging-config.xml file, in the <sites-shared>/config directory on your application server.
Note:
Log4j log levels set by users cannot be migrated to ODL logs. Users must set these levels manually after the upgrade.The following logger levels are available, listed in order of decreasing verbosity:
ERROR:1, WARNING:1, NOTIFICATION:1, TRACE:16, TRACE:1, OFF
OFF indicates that a logger does not write any statements to the log. For more information about logger levels, see the Oracle Diagnostic Logging (ODL) documentation.
To change a logger level:
-
In the General Admin tree, expand the Admin node, expand the System Tools node, and then double-click Configure Log ODL.
The list of loggers with explicitly assigned levels opens. If you require a more granular view, you can click Show All Known Loggers at the bottom of the form to expand the list to include loggers that inherit levels from parent loggers.
-
Find the logger to change and select a new logger level in the Set New Level column.
The new level opens in the Level column.
When the logger is executed, you can track the impact of the new level in the log. See Viewing the Log.
-
If you want the new logger level to remain in effect after WebCenter Sites is restarted, you must manually change the logger level in the logging-config.xml file. For instructions, see Changing Logger Levels in Property Files Reference for Oracle WebCenter Sites.
31.1.3 Adding New Loggers
If you wish to add new loggers to the ODL framework in your WebCenter Sites system and you do not want them to inherit verbosity levels from the root logger or parent logger, you can add the loggers through the Admin interface and assign each of them a verbosity level. (If you add your own custom loggers, be sure to deploy the supporting class and jar files.)
Assigned verbosity levels remain in effect only until WebCenter Sites is restarted, but if you wish to apply the levels permanently, you can manually add the logger properties to the logging-config.xml file in the <sites-shared>/config directory on your application server.
To add a new logger:
-
In the General Admin tree, expand the Admin node, expand the System Tools node, and then double-click Configure Log ODL.
The list of loggers with explicitly assigned levels is shown.
-
In the field below the list of loggers, enter the name of the logger you want to add and select its verbosity level.
-
Click Add Logger.
The new logger is added to the list. As soon as the logger is executed, you can track the impact of the assigned level in the log (see Viewing the Log).
-
If you want the added logger to remain in effect after WebCenter Sites is restarted, add the logger to the
logging-config.xmlfile. For instructions, see Adding Loggers in Property Files Reference for Oracle WebCenter Sites.
31.2 Using the System Information Tool
The System Information tool provides immediate access to various types of WebCenter Sites, database, and thread information for troubleshooting and checking the health of your application. You can download information to a file or view information directly in the administrator's interface.
This section covers the following topics:
-
Note:
You can download all available system information and a list of all WebCenter Sites directories and files on the application server by right-clicking the System Information tool and selecting Download. If Sigar is configured, you can also download Sigar information to send to Technical Support by right-clicking the tool and selecting System Details (Sigar).
31.2.1 Viewing WebCenter Sites Information
You can download or view the following types of WebCenter Sites information:
-
Memory Information – The amount of free memory in the application server Java Virtual Machine, the total amount of memory free and in use, and the maximum amount of memory that the Java Virtual Machine will attempt to use.
-
Sites Properties – The
ini,xml, andpropertiesfiles in the WebCenter Sites installation directory. -
Web Apps Properties – The
xmlandpropertiesfiles in theWEB-INFandWEB-INF/classesdirectories on the application server. -
Other Sites Info – The
jarfiles in theWEB-INF/libdirectory on the application server, the session variables for the user currently logged in to WebCenter Sites, and the Java run-time properties.
To download or view WebCenter Sites information:
-
In the General Admin tree, expand the Admin node, expand the System Tools node, then expand the System Information node, and then double-click Sites Info.
The WebCenter Sites Information form is shown.
This form shows memory information and additional information that you can select to download or view.
-
In the Sites Properties and Web Apps Properties sections, select the files that you are interested in and click Add.
-
In the Other Sites Info section, do the following:
-
To obtain information about the
jarfiles in theWEB-INF/libdirectory on the application server, select the Jar Versions check box. -
To obtain the session variables for the user currently logged in to WebCenter Sites, select the Sites Session Variables check box.
-
To obtain Java run-time properties, select the System Variables check box.
-
-
To download the selected WebCenter Sites information as a text file, click Download and then open or save
SysInfo.zip. The text file is insideSysInfo.zip. -
To view the selected WebCenter Sites information in the administrator's interface, click Show Results.
-
The selected files and information are displayed directly in the administrator's interface.
-
To view the details of a file or type of information, click its "plus" icon.
For
iniandpropertiesfiles, and WebCenter Sites session variables and system variables, the properties and values are shown in the following figure.Figure 31-2 Properties and Values for cas.properties
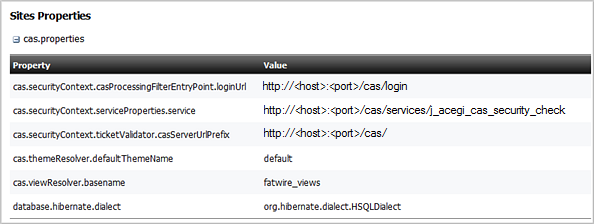
Description of "Figure 31-2 Properties and Values for cas.properties"For
xmlfiles, the code is shown in the following figure.For Jar Versions, the
jarnames, versions, and implementation vendors are shown in the following figure.NA : NAindicates that ajarfile does not provide its version and vendor.
-
31.2.2 Viewing Database Information
You can download or view the following types of database information:
-
Basic Information – The database engine and version, default transaction isolation level, JDBC driver, URL, and version, and JNDI data source.
-
System Tables – Tables that store core WebCenter Sites data. The ElementCatalog table, for example, lists all of the XML or JSP elements used in your system.
-
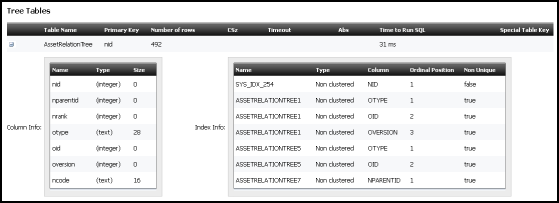
Tree Tables – Tables that store parent-child relationships between objects. The AssetRelationTree, for example, stores information about the associations between assets.
-
Sites Object Tables – Tables that store uniquely identified objects, such as asset types, asset attributes, and asset definitions.
-
Other Sites Tables – Tables that store flat data that cannot be organized into parent-child relationships and the foreign tables that WebCenter Sites does not manage.
Note:
You have permission to access a database table if at least one Access Control List (ACL) assigned to the table is assigned to your user. See Access Control Lists (ACLs) and Types of Database Tables in Developing with Oracle WebCenter Sites.
To download or view database information:
-
In the General Admin tree, expand the Admin node, expand the System Tools node, expand the System Information, and then double-click DB Info.
The Database Information form is displayed with basic information about your database and the tables that you can select to download or view.
-
In the System Tables, Tree Tables, Sites Object Tables, and Other Sites Tables sections, select the tables to view and click Add.
-
To download the selected database information as a spreadsheet file, click Download and then open or save
SysInfo.zip. The spreadsheet file is insideSysInfo.zip. -
To view the selected database information in the administrator's interface, click Show Results.
-
For each selected table that you have permission to access, the following information opens:
-
Table Name
-
Primary key
-
Number of rows
-
CSz (number of resultsets to cache in memory)
-
Timeout (number of minutes to keep a resultset cached in memory)
-
Abs (how to calculate the expiration time for resultsets)
-
Time to run SQL
-
Special table key
-
-
To view a table's column and indices, click its "plus" icon. If an index is listed more than one time, it extends across multiple rows, as illustrated in the following figure.
-
31.3 About Using the Cache Management Tool
If the inCache framework is set up for page caching, asset caching, or both, the Cache Management tool enables you to monitor the caching processes on WebCenter Sites cluster members and their co-resident Satellite Servers. Features include cache searching, force writing to disk, and flushing individual pages, assets, dependencies, and entire caches.
Note:
The Cache Management tool provides caching information only for WebCenter Sites cluster members and their co-resident Satellite Servers. To access cache information for remote Satellite Servers, use the following URL:
http://<server>:<port>/<application_context_path>/Inventory?username=<SatelliteServer>&password=<password>&detail=debug31.4 Working with Cache Management - CAS Cache
This section shows you cache management for CAS Cache.
This section includes the following topics:
31.4.1 Overview of the CAS Cache Summary Form
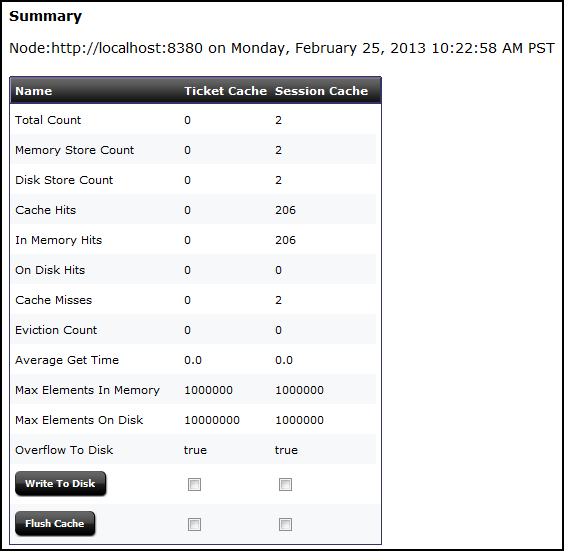
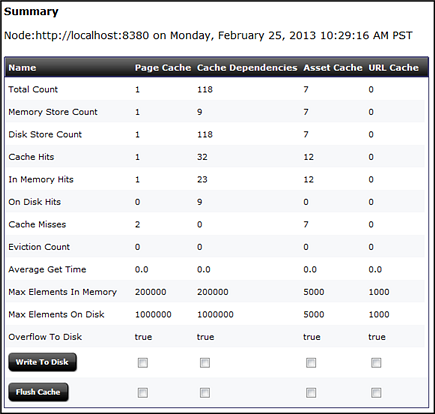
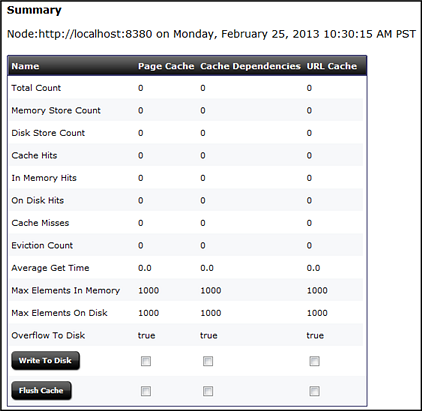
The CAS Cache Summary form lists the following basic data for each cache (values are estimates):
-
Total Count (total number of cached elements)
-
Memory Store Count (number of cached elements in memory)
-
Disk Store Count (number of cached elements on disk)
-
Cache Hits (number of cached elements retrieved from both memory and disk)
-
In Memory Hits (number of cached elements retrieved from memory)
-
On Disk Hits (number of cached elements retrieved from disk)
-
Cache Misses (number of times elements were not found in the cache)
-
Eviction Count (number of elements evicted from the cache)
-
Average Get Time (average number of milliseconds for retrieving an element)
-
Max Elements In Memory (maximum number of elements allowed in memory)
-
Max Elements On Disk (maximum number of elements allowed on disk)
-
Overflow to Disk (whether elements are written to disk when memory is full)
This form also provides the following options. They should be used with caution, especially on a delivery system, as they can impact the performance of your site.
-
Writing a cache's entire memory store to disk. This option can be particularly useful if WebCenter Sites is not set up to automatically write a cache's memory store to disk before shutting down.
-
Flushing a cache's entire memory and disk stores.
Note:
If legacy page caching is enabled, cached page data is stored in the SystemPageCache table and information about the stored data is not displayed in the Summary window.
To view and work with summary cache information:
31.4.2 Working with Cluster Information
If Sigar is configured, this form lists the name, URL, port, and GUID of each additional WebCenter Sites cluster member.
To view and work with cluster information:
- In the General Admin tree, expand the Admin, and then expand the System Tools node.
- Under the System Tools node, expand the Cache Management node, expand the CAS Cache node, and then double-click Cluster Info.
The Cluster Info page is shown in the following figure.
31.5 Working with Cache Management - Resultset Cache
Oracle WebCenter Sites caches resultsets to help optimize system performance. Caching prevents overloading the database with repeated queries for the same information, and serving from cache is always faster than performing another database lookup.
By default, WebCenter Sites stores resultsets within the inCache framework, instead of hash tables. Both caching frameworks use Java memory. You can switch between frameworks by using the Property Management Tool in the Admin interface to set the rsCacheOverInCache property (in wcs_properties.json) to either true or false.
When resultset caching over inCache is enabled, the System Tools node shows the Resultset Cache tool, which provides statistical information about the caches and their contents as described in this section. Additional information about resultset caching is available in Working with Resultset Caching and Queries in the Developing with Oracle WebCenter Sites.
This section covers the following topics:
31.5.1 Enabling and Configuring Resultset Caching over inCache
If resultset caching over inCache is not enabled, caching in hash tables is enabled by default.
To enable and configure resultset caching:
-
Enable resultset caching:
-
Make sure the
linked-cache.xmlconfiguration file is present in the application server's classpath (WEB-INF/classesdirectory). -
In the Admin interface, access the Property Management Tool, find the
rsCacheOverInCacheproperty, and set its value totrue. (For instructions about using the Property Management Tool to modify properties, see Properties in the Cache Category in Property Files Reference for Oracle WebCenter Sites.
-
-
Configure resultset caching:
In the Property Management Tool, set values for the following resultset caching properties:
-
cc.cacheResults– Specify the default number of resultsets to cache. -
cc.cacheResultsTimeout– Specify the number of minutes to keep a resultset cached. -
cc.cacheResultsAbs– Specify how expiration time is calculated for cached resultsets.
-
31.5.2 Summary View
The summary view of resultset cache shows statistical information about all caches. You can select a cache from the summary table to view the database queries it contains. You can further view the resultset elements of the database queries contained in a cache.
To view cache information:
31.6 Working with Cache Management - Sites Cache
The following topics provide information about cache management for Sites Cache:
31.6.1 Overview of the Sites Cache Summary Form
The Sites Cache Summary form lists the following basic data for each cache (values are estimates):
-
Total Count (total number of cached elements)
-
Memory Store Count (number of cached elements in memory)
-
Disk Store Count (number of cached elements on disk)
-
Cache Hits (number of cached elements retrieved from both memory and disk)
-
In Memory Hits (number of cached elements retrieved from memory)
-
On Disk Hits (number of cached elements retrieved from disk)
-
Cache Misses (number of times elements were not found in the cache)
-
Eviction Count (number of elements evicted from the cache)
-
Average Get Time (average number of milliseconds for retrieving an element)
-
Max Elements In Memory (maximum number of elements allowed in memory)
-
Max Elements On Disk (maximum number of elements allowed on disk)
-
Overflow to Disk (whether elements are written to disk when memory is full)
This form also provides the following options. They should be used with caution, especially on a delivery system, as they can impact the performance of your site.
-
Writing a cache's entire memory store to disk. This option can be particularly useful if WebCenter Sites is not set up to automatically write a cache's memory store to disk before shutting down.
-
Flushing a cache's entire memory and disk stores
Note:
If legacy page caching is enabled, cached page data is stored in the SystemPageCache table and information about the stored data is not displayed in the Summary window. This window also shows the Clear Page Cache button, which allows you to flush the stored data in System Page Cache and Co-Res SS Cache.
As System Page Cache is legacy, it must be enabled for use. This is done by disabling Ehcache by including the following as a JVM parameter of appserver:
-Dcs.useEhcache=false
To view and work with summary cache information:
If you have enabled System Page Caching, a button labeled Clear Page Cache will appear underneath the Flush Cache button. Click Clear Page Cache to flush the SystemPageCache table and Co-Res SS Cache.
31.6.2 Working with Page Cache
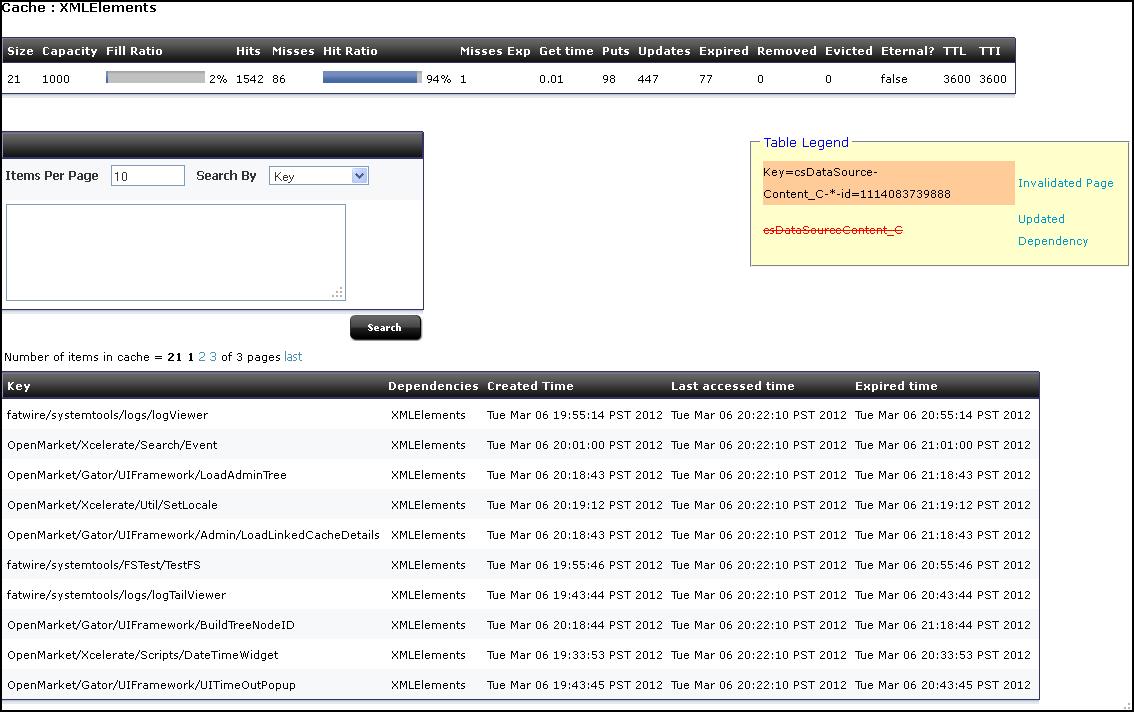
This form lists statistics for each cached page, such as visit count, time of creation/last access/expiration, and dependencies. The table legend identifies which types of information are tracked: invalidated pages, updates to dependencies, and changes to the dependency generation count. The form also provides the following options:
-
Searching the cache for specific pages – Searches are CPU intensive and should be used with caution on a delivery system.
-
Flushing pages from the cache.
-
Viewing html information for pages.
-
Looking up page dependencies.
The view and work with items in the Page Cache:
Note:
After WebCenter Sites is restarted, this form does not show page cache information until the cache engine is initialized. The cache engine is initialized when the first page or asset is requested.
31.6.3 Working with the Dependency Cache
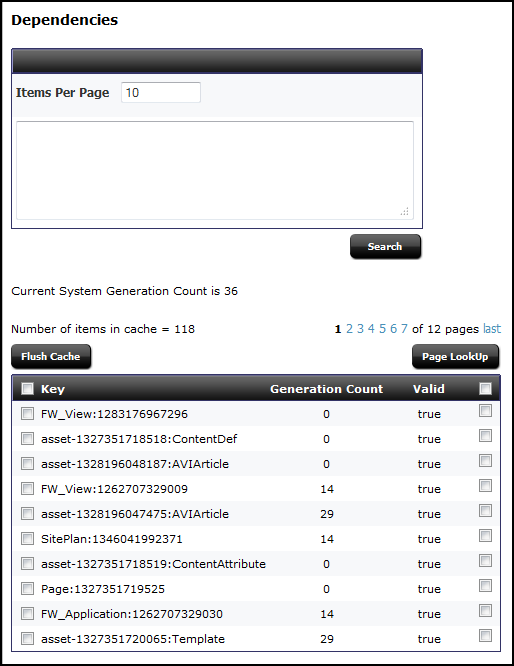
This form lists the contents of the dependency cache and the generation count for each dependency. In addition, it provides the following options:
-
Searching the cache for specific dependencies – Searches are CPU intensive and should be used with caution on a delivery system.
-
Flushing dependencies from the cache
-
Looking up page dependencies
The view and work with items in the Dependency Cache:
Note:
After WebCenter Sites is restarted, this form does not show dependency cache information until the cache engine is initialized. The cache engine is initialized when the first page or asset is requested.
31.6.4 Working with the Asset Cache
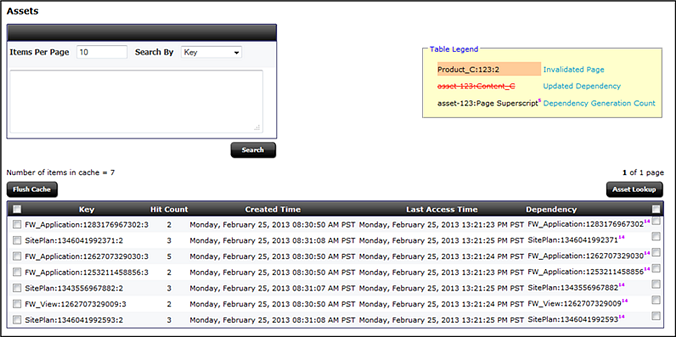
This form lists statistics for each cached asset, such as visit count, time of creation/last access, and dependencies. The table legend identifies which types of information are tracked: invalidated assets, updates to dependencies, and changes to the dependency generation count. The form also provides the following options:
-
Searching the cache for specific assets. Searches are CPU intensive and should be used with caution on a delivery system.
-
Flushing assets from the cache
-
Looking up asset dependencies
The view and work with items in the Asset Cache:
Note:
After WebCenter Sites is restarted, this form does not show asset cache information until the cache engine is initialized. The cache engine is initialized when the first page or asset is requested.
31.6.5 Working with the URL Cache
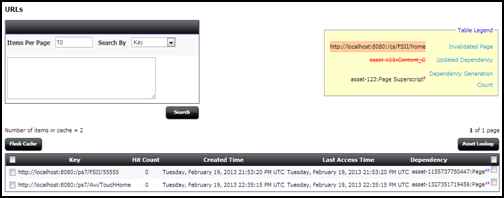
All the Vanity URLs are cached after the resolution is done in a web page in inCache. The cache can be looked up and managed in the Cache Management node under System Tools.
The view and work with items in the URL Cache:
31.7 Working with Cache Management - Co-Res Cache
The following topics provide information about cache management for the Co-Res Cache:
31.7.1 Overview of the Co-Res SS Cache Summary Form
The cache summary form for the Co-Res Satellite Server lists the following basic data for each cache (values are estimates):
-
Total Count (total number of cached elements)
-
Memory Store Count (number of cached elements in memory)
-
Disk Store Count (number of cached elements on disk)
-
Cache Hits (number of cached elements retrieved from both memory and disk)
-
In Memory Hits (number of cached elements retrieved from memory)
-
On Disk Hits (number of cached elements retrieved from disk)
-
Cache Misses (number of times elements were not found in the cache)
-
Eviction Count (number of elements evicted from the cache)
-
Average Get Time (average number of milliseconds for retrieving an element)
-
Max Elements In Memory (maximum number of elements allowed in memory)
-
Max Elements On Disk (maximum number of elements allowed on disk)
-
Overflow to Disk (whether elements are written to disk when memory is full)
This form also provides the following options. They should be used with caution, especially on a delivery system, as they can impact the performance of your site.
-
Writing a cache's entire memory store to disk. This option can be particularly useful if WebCenter Sites is not set up to automatically write a cache's memory store to disk before shutting down.
-
Flushing a cache's entire memory and disk stores.
Note:
If legacy page caching is enabled, cached page data is stored in the SystemPageCache table and information about the stored data is not displayed in the Summary window.
To view and work with summary cache information:
31.7.2 Working with the Page Cache
This form lists statistics for each cached page, such as visit count, time of creation/last access/expiration, and dependencies. The table legend identifies which types of information are tracked: invalidated pages, updates to dependencies, and changes to the dependency generation count. The form also provides the following options:
-
Searching the cache for specific pages – Searches are CPU intensive and should be used with caution on a delivery system.
-
Flushing pages from the cache.
-
Viewing html information for pages.
-
Looking up page dependencies.
The view and work with items in the Page Cache:
Note:
After WebCenter Sites is restarted, this form does not show page cache information until the cache engine is initialized. The cache engine is initialized when the first page or asset is requested.
31.7.3 Working with the Dependency Cache
This form lists the contents of the dependency cache and the generation count for each dependency. In addition, it provides the following options:
-
Searching the cache for specific dependencies. Searches are CPU intensive and should be used with caution on a delivery system.
-
Flushing dependencies from the cache.
-
Looking up page dependencies.
The view and work with items in the Dependency Cache:
Note:
After WebCenter Sites is restarted, this form does not show dependency cache information until the cache engine is initialized. The cache engine is initialized when the first page or asset is requested.
31.7.4 Working with the URL Cache
All the Vanity URLs are cached after the resolution is done in a web page in inCache. The cache can be looked up and managed in the Cache Management node under System Tools.
The view and work with items in the URL Cache:
31.8 Using the Log Viewer
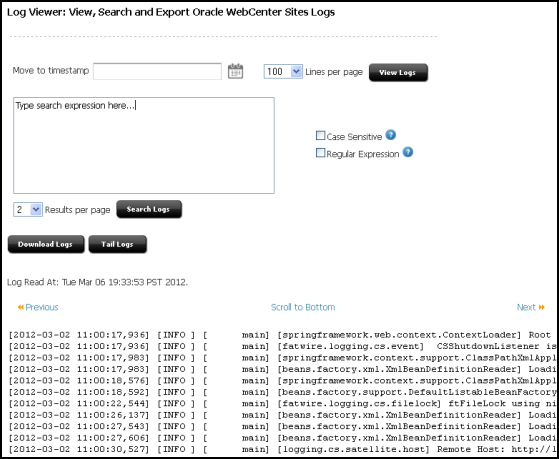
The Log Viewer tool enables you to view, tail, download, and search the contents of the WebCenter Sites log specified in the logging-config.xml file directly from the WebCenter Sites Admin interface. Since the total size of the log affects the tool's performance, if the log size exceeds 100 megabytes, you are informed and given the choice to proceed or cancel.
The following topics provide information about using the Log Viewer tool:
31.8.1 Viewing the Log
You can browse the entire contents of the WebCenter Sites log, starting with statements written most recently or written at a specific time.
To view the contents of the log:
-
In the General Admin tree, expand the Admin node, expand the System Tools node, and then double-click Log Viewer.
The Log Viewer form shows the most recent 100 lines in the log.
-
To jump to statements written at a specific time, do the following:
-
Click the calendar icon and select a date and time, or enter the date and time manually in the yyyy-mm-dd hh:mm:ss format.
Note:
This feature operates only on log statements that were written with the timestamping pattern specified in the
logging-config.xmlfile. -
Click View Logs.
The Log Viewer form is shown.
The form shows the statements written at and after the specified date and time.
-
31.8.2 Tailing the Log
You can tail the WebCenter Sites log in a separate window. This option is particularly useful when you want to keep track of the statements written to the log while executing an action that causes an exception.
To tail the contents of the log:
31.8.3 Downloading the Log
You can download a compressed file containing the entire contents of the WebCenter Sites log.
To download the contents of the log:
31.9 Performance Test
You can determine performance of File System and Lucene Indexing by tools provided in WebCenter Sites under System Tools in Admin tab.
31.9.1 File System Test
The File System Test tool enables you to test the local application server directory and the central directories in the shared file system (<cs_install_dir>/Shared) to compare their performance with provided benchmarks.
Table 31-3 Tested File Systems
| FileSystem | Description |
|---|---|
|
spc |
Shared page cache directory for all WebCenter Sites cluster members. Sample path:
|
|
local |
Temporary directory for servlet context information. Sample path:
|
|
data |
Shared blob data directory for all WebCenter Sites cluster members. Sample path:
|
|
sync |
Shared synchronization directory for all WebCenter Sites cluster members. Sample path:
|
A test suite is made of several tests performed on the local application server directory and the shared file system directories. Each of these tests executes multiple threads. Each thread creates an empty file and then writes to, reads, and deletes the file. The following test suites are available:
-
Short Test that runs a total of 16 tests (4 tests are performed on each of the directories listed in the table above).
-
Medium Test that runs a total of 64 tests (16 tests are performed on each of the directories listed in the table above).
-
Extensive Test – runs a total of 384 tests (96 tests are performed on each of the directories listed in the table above).
To test the file system:
-
In the General Admin tree, expand the Admin node, expand the System Tools node, expand the Performance Test node, and then double-click File System Test.
The File System Test form is shown.
-
Select the type of test you want to perform and click Start Test.
Note:
-
If the test takes too long or affects performance too much, you can click Stop Test.
-
The results of a file system test can be compared with the provided benchmark only when the test is completed.
-
-
Once the test is complete, review the overall results in the Performance Summary table. The following information is shown for each directory:
-
Numbers displayed in bold are benchmarks. The benchmarks were calculated by running standard tests on an Oracle Secure Linux 5.4 system connected to a 10K RPM SAS300 HD through NFS version 4. Both the client and server were on the same network switch and there was no additional traffic at the time of the test.
-
FileSystem specifies the directory the test was performed on.
-
Path specifies the path to the directory a file system test was performed on.
-
Create specifies the average number of microseconds a create operation was performed.
-
Write specifies the average number of microseconds a write operation was performed.
-
Read specifies the average number of microseconds a read operation was performed.
-
Delete specifies the average number of microseconds a delete operation was performed.
-
-
For detailed information about each test, review the graph (located under the Performance Summary table) and the test results table (located under the graph).
-
To view the results of a single test, either hover over a point on the graph or navigate to the row in the test results table.
The following information is shown in the table for each test:-
Test lists a serial number for each test.
-
Threads lists the number of threads created during the test.
-
Files lists the number of files created per thread.
-
Size lists the number of bytes per file.
-
Reads lists the number of times each file was read by a test.
-
Lock lists if each file was locked (random access lock operation).
-
Attributes lists whether each file's attributes were read during the test.
-
Mode lists the Java I/O random access mode for accessing the files in the thread.
-
FileSystem lists the directory on which the test was performed.
-
Create lists the minimum, maximum, and average number of microseconds in which the test performed a create operation.
-
Write lists the minimum, maximum, and average number of microseconds in which the test performed a write operation.
-
Read lists the minimum, maximum, and average number of microseconds in which the test performed a read operation.
-
Delete lists the minimum, maximum, and average number of microseconds in which the test performed a delete operation.
-
Total Test Time lists the total number of microseconds in which a test was completed.
In the test results table, expand a row to view detailed information about each thread that was created during a specific test. The following information is shown in the thread detail table:-
Thread lists a serial number for each thread.
-
Create lists the total number of microseconds the thread created an empty file.
-
Write lists the total number of microseconds the thread finished writing to the file.
-
Read lists the total number of microseconds the thread read the file it created.
-
Delete lists the total number of microseconds the thread deleted the file.
Note:
-
Each point on a graph and row in a table shows information for a single test.
-
To view the details of a single test, when you hover over a point in the graph, use a browser other than Internet Explorer.
-
31.9.2 Lucene Indexing Test
You can use the Lucene Indexing Test tool to test the performance of Lucene indexing, either on shared file system, that is (<cs_install_dir>/Shared/lucene) or on NIO (Non-blocking I/O), that is sharefs://Shared/lucene. The results of these tests are compared against benchmark results.
-
Short test suite that runs a total of 16 tests.
-
Medium test suite that runs a total of 64 tests.
-
Extensive test suite that runs a total of 384 tests.
To test Lucene indexing:
31.10 Working with Slots Assets
Slots assets are used to store presentation changes made when editing a website in context. Slots assets are managed transparently, they are not available in the user interfaces. The Slots node in System Tools where you void or delete existing slot data.
A deleted slot asset has its rows removed from the database table. A voided slot asset is an asset that has had its status changed to VO. However, it is not removed from the database so it will also not show up in any searches and similar inquiries. Voided assets can be physically removed in a purge. See Working with the Purge Voided Assets Node.
To void Assets or delete Assets:
When an asset is voided, it doesn't appear in any lists of assets or searches for assets. However, it is still taking space in the database. In some cases, the space taken up by voided assets must be reclaimed; this is handled through purging voided assets. For information about how to purge voided assets, see Working with the Purge Voided Assets Node.
31.11 Working with the URL Node
The URL node allows you to search, view, and delete custom URLs, also known as vanity URLs. These URLs are domains used to redirect to a certain section of your website, which may or may not be accessible to the rest of the hosted website. Often these vanity URLs are used to prevent a long URL that has coded strings within it, making it easier for the web user to view your page.
To view and manage vanity URLs:
