11 Working with the Content Audit Report
The Content Audit Report provides an overall picture of the content management system at any given time by giving you an in-context analysis about the content management system. For example, you can get detailed reports for a selected period on managed and published content, content workflow, as well as authors working on the content for your site. To view the Content Audit report, you must be assigned the MarketingAuthor role.
Topics
11.1 How do I view the Content Audit Report?
You can view the content audit report from the Contributor interface. The report provides data on a whole host of things, such as authoring statistics, authoring productivity, publishing, details, asset types, and so on. You can also view this data for specific time periods.
In the Contributor interface, select Content > Content Audit. Use the filter option to view the data for a selected time period by specifying day, week, month or year in the Select range field and setting the from and to date/time. Click Submit to get the report.

Description of the illustration sa_caheader.png
Learn how to analyze the data in the Content Audit Report:
11.1.1 What is the Content Audit Report Metrics Bar?
The Content Audit Report metrics bar is located just below the header. It shows authoring statistics such as, total number of edited or new assets for the selected reporting period.
Each of the tickers, except total assets, is a link that opens a Search tab when you click on it. For example, if you click edited assets, the Search tab lists all the assets that were edited during the selected time period.
| Ticker | Description |
|---|---|
|
total assets |
Indicates the total number of assets in the site during the reporting period. |
|
edited assets |
Indicates the number of assets that were edited during the reporting period. Click to see a listing all the assets that were edited during the selected time period. |
|
new assets |
Indicates the number of the assets that were created during the reporting period. Click to see a listing all the assets that were created during the selected time period. |
|
workflow assignments |
Indicates the number of workflow assignments that were completed during the reporting period. -OR- Indicates the number of workflow assignments in progress for the current reporting period. Click to see a listing all the assets that are part of a workflow assignment during the selected time period. |
|
checkedout assets |
Indicates the number of assets that have been checked out by Contributor interface users during the reporting period. Click to see a listing all the assets that have been checked out during the selected time period. |
|
placed pages |
Indicates the number of pages that have been placed under a site navigation in the Site Tree during the reporting period. Click to see a listing the pages that have been placed under a site navigation node during the selected time period. |
|
unplaced pages |
Indicates the number of pages under the Unplaced Pages node in the Site Tree during the reporting period. Click to see a listing all the pages that have been unplaced during the selected time period. |
11.1.2 What is the Authoring Statistics Chart?
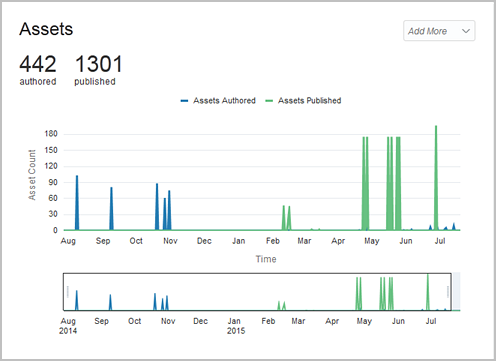
Use the Authoring Statistics Chart to plot the number of assets authored (created and edited) against the number of assets published for a selected period of time (except for technical assets such as Template assets).
There’s an Add More drop-down menu with the options: Edited, Checked out, and Held. When you select one of these options, a third line appears in the chart that plots the data related to the selected option.
Table 11-1 Authoring Statistics Chart Options
| Option | Description |
|---|---|
|
Edited |
Plots the number of assets that were edited during the reported time period. |
|
Checked out |
Plots the number of assets that have been checked out during the reported time period. |
|
Held |
Plots the number of assets that have been held for publishing during the reported time period. |
11.1.3 What is the Publish Details Report?
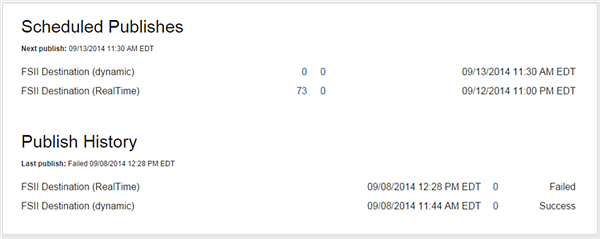
The Publish Details Report is for a selected time period and is divided into two sections; it provides details about scheduled publishing jobs in one section and publishing history in the other.
You can get information on the publishing jobs scheduled for a selected time period from the Scheduled Publishes section. The date of the next publishing session is shown at the top of the report.
Table 11-2 Scheduled Publishes Section
| Column | Description |
|---|---|
|
Destination |
The name of the publishing destination. |
|
Publish Time |
The date the publishing event will occur. |
|
#Assets |
The number of assets involved in the publishing event. Click the number of assets to view a list of assets to be published during the scheduled publishing event. |
|
#Assets Held |
The number of assets that are held (not being published) during this scheduled publishing event. |
Publish History section shows publishing events that have occurred during a selected time period. The publishing events are shown in reverse chronological order with the most recent at the top.
Table 11-3 Publish History Section
| Column | Description |
|---|---|
|
Publisher |
The name of the user who triggered the publishing session. |
|
Destination |
Name of the publishing destination. |
|
Publish Date |
The date on which the publishing job ran. |
|
Status |
Shows the status of the publishing job. Possible values are:
|
|
#Assets Published |
Shows the number of assets published for a particular publishing job. |
|
#Assets Held |
Shows the number of assets that were held (not published) during the publishing job. |
11.1.4 What is the Author Productivity Chart?
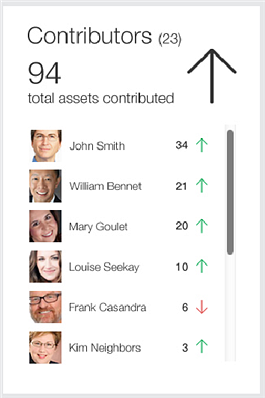
You’ll often need information on content contributors who created and edited assets in a selected time period. Get this information from the Author Productivity Report.
At the top, you see the total number of contributors and the total number of assets that were created and edited during a selected time period. The chart also displays an arrow that indicates a positive or negative trend.
You can also see the number of assets each user has worked on for a selected time period. A trend arrow indicates whether this number is higher or lower than the previous period.
11.1.5 What is the Content Tags cloud?
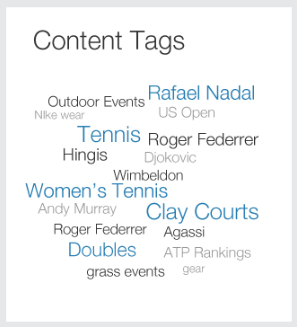
The Content Tags cloud shows you the most common tags applied to assets during a selected time period.
The larger the text, the more often the tag is used. By default, the cloud shows the top 50 tags. When you click a tag, a search is run for all assets that are tagged with this content.
11.1.6 What is the Asset Types list?
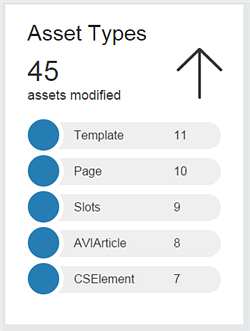
Get a list of the top five asset types that have been created or edited during a selected time period from the Asset Types list.
At the top, you can see the total number of times the top five asset types have been modified (created or edited) for the selected time period. A trend arrow shows you whether these asset types were modified more or less times during this time period compared to the previous time period.
Below is a list of these top five asset types and the number of times each asset was modified during the selected time period.
11.1.7 What is the Top Internal Searches list?
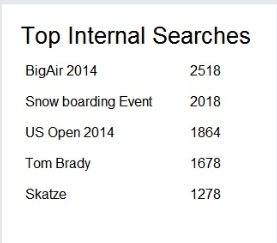
Get a list of the top 10 search words or phrases for the Contributor interface for a selected time period from the Top Internal Searches list. They’re the top 10 words which your Contributor interface users have entered into the Search field.
The number next to the search word indicates the number of times it was used during the selected time period. Click a keyword to view the search result.

