How to View Threads

A process instance is always run by a single logical thread, whether it is a synchronous or asynchronous process (the process ID can be thought of as the thread). The SOA debugger sees and uses the logical thread. If a process has a flow or flowN activity, then several logical threads run the flow or flowN activity.

To view threads:
  1. From the main menu, select Window > Debugger > Threads.

    The Threads tab is displayed in the Structure window.

  2. Step into the service binding component of the BPEL process to begin debugging.

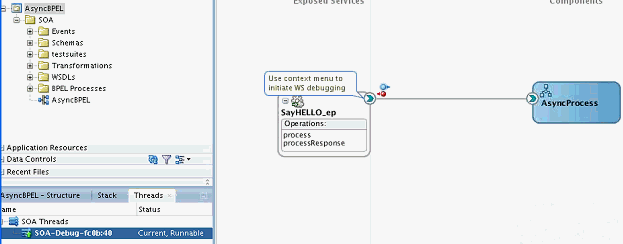
    The thread value for the request is 40, as shown in the Structure window in Figure 50-27.

    Figure 50-27 Request Thread Value

    Description of Figure 50-27 follows
    Description of "Figure 50-27 Request Thread Value"
  3. Step into the receive activity of the asynchronous BPEL process.

    The thread value for the reply is 41, as shown in Figure 50-28.

    Figure 50-28 Reply Thread Value

    Description of Figure 50-28 follows
    Description of "Figure 50-28 Reply Thread Value"