6 Recovering From Faults in the Error Hospital
This chapter includes the following sections:
For information about tracking the status of business flow instances, see Tracking Business Flow Instances .
Managing Faults in the Error Hospital
You can manage all faults occurring within Oracle SOA Suite and view aggregated statistics associated with faults data on the Error Hospital page.
The Error Hospital page provides the following benefits:
-
A single location for managing and recovering from all aggregated faults occurring within Oracle SOA Suite (including rejected message recovery and BPEL message recovery). Regardless of the service engine or binding component in which the fault occurred, you manage faults from the Error Hospital page at the following levels:
-
At the SOA Infrastructure level, where all system-wide faults data is aggregated for each business flow instance.
-
At the individual SOA folder level, where only faults data for the business flow instances associated with that specific SOA folder is aggregated.
-
-
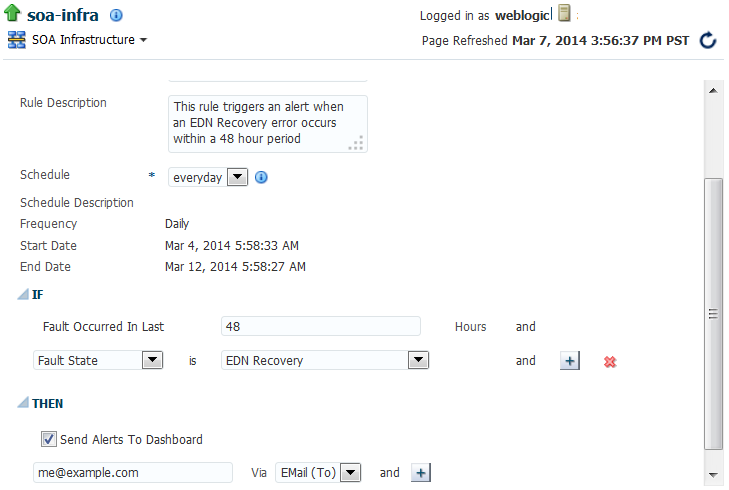
Error notification rules configuration for triggering an alert when specific fault criteria are met. For example, you define a rule to trigger an alert if more than 10 errors occur in a 48 hour period.
-
Fault filtering and searching capabilities, and the ability to aggregate fault statistics by name, code, type, owner, and other grouping criteria.
-
Bulk fault recovery and termination capabilities.
-
Details of flow instances associated with the aggregated faults for examining fault trends.
To manage faults in the error hospital:
Access this page through one of the following options:
To access faults in all SOA folders:
| From the SOA Infrastructure Menu... | From the SOA Folder in the Navigator... | From the SOA Composite Menu... |
|---|---|---|
|
|
|
To access faults in an individual SOA folder:
| From the SOA Infrastructure Menu... | From the SOA Folder in the Navigator... |
|---|---|
|
|
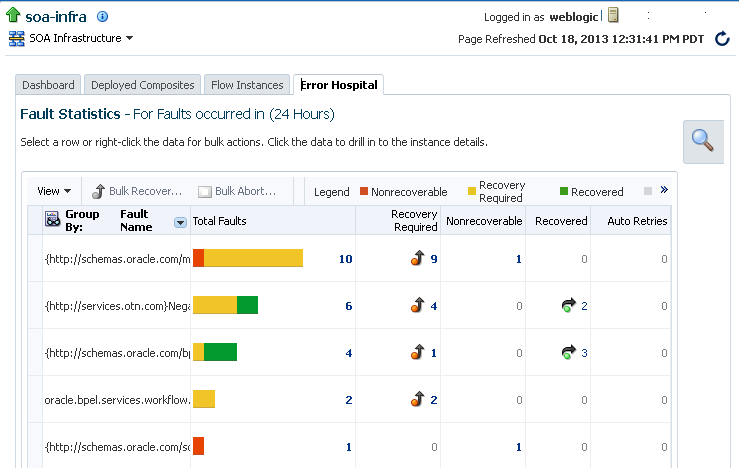
The Error Hospital page displays the following details:
-
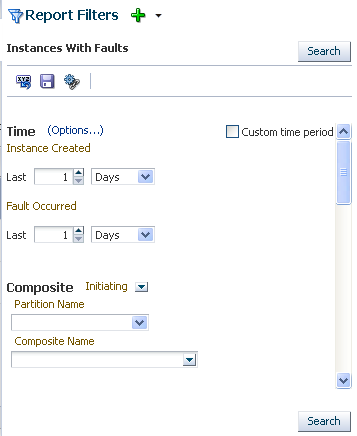
A utility for specifying and saving comprehensive fault search criteria and clicking Search.
Note:
When you initially access the Error Hospital page, the Fault Statistics table is empty. You must click Search to populate this table with fault details.
-
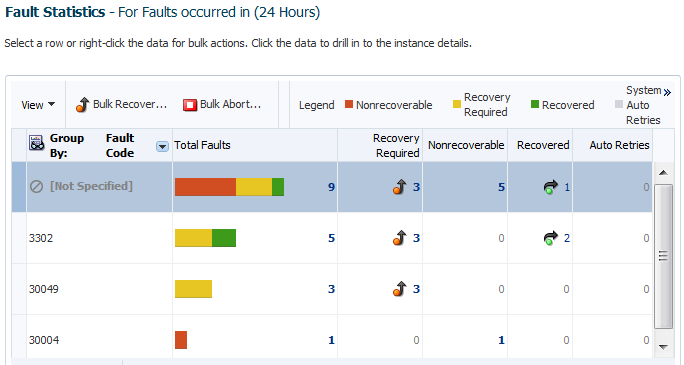
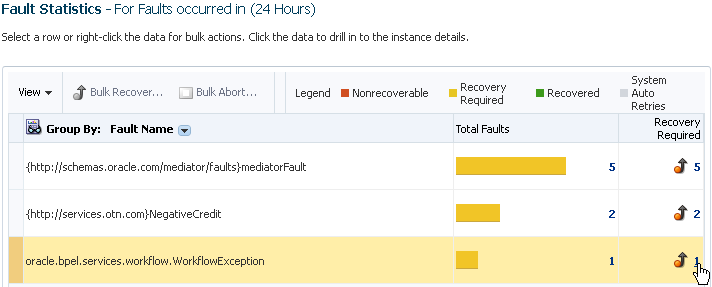
A Fault Statistics table that provides the fault name, total number of faults, faults requiring recovery, unrecoverable faults, recovered faults, and automatic fault retries. Click a number to search for flow instances associated with the aggregated faults (this takes you to the Flow Instances page). To display a different fault attribute in the first column of the table (such as fault name, code, type, owner, and other grouping criteria), select the Group By list. To display additional columns in the table, select View > Columns.
-
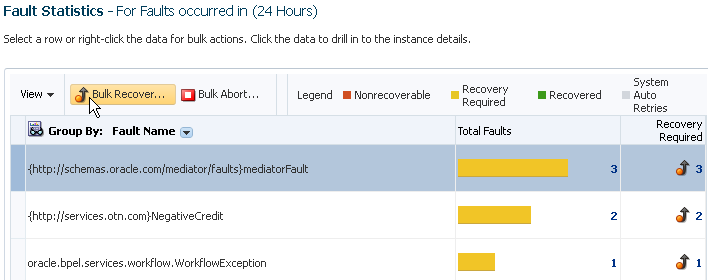
Bulk Recovery and Bulk Abort buttons above the Fault Statistics table for performing bulk actions (recovery or abort) on a selected group of similar faults in a single operation.
Note:
-
When you click a faults link or similar links elsewhere in Oracle Enterprise Manager Fusion Middleware Control, you are taken to the Error Hospital page with the fault report data already displayed. For example, when you click the Error Hospital button above the Search Results table in which business flow instances are displayed on the Flow Instances page, you see the aggregated fault statistics reported for those flow instances. In addition, when you click a specific fault state in the graph in the Business Transaction Faults section of the Dashboard page, you are taken to the Error Hospital page with the fault report data of the selected state already displayed.
-
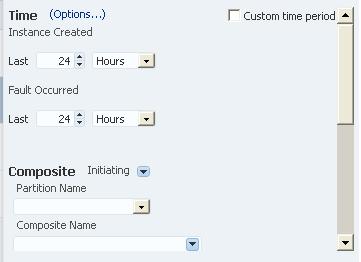
Report data is delimited by the time period for which instances and faults are retrieved. The current delimiter is displayed to the right of the Fault Statistics table title. The default value is 24 hours. You can change this value with the Default Query Duration property on the SOA Infrastructure Common Properties page. For information, see Configuring the Audit Trail, Payload Validation, and Default Query Duration.
-
You can perform the following fault management tasks:
Specifying and Saving Fault Search Criteria
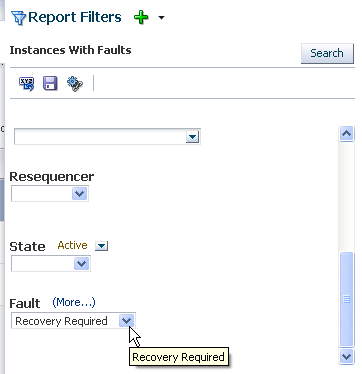
The Report Filters section enables you to specify and save comprehensive fault search criteria. Search results are displayed in the Fault Statistics table.
To specify and save fault search criteria:
Executing Predefined Fault Instance and Custom Searches
You can quickly find faults without entering any search criteria by selecting a predefined search option. Results are displayed in the Fault Statistics table. The searches are constrained by a predefined time period. The default time period is 24 hours. This value can be changed by modifying the Default Query Duration property in the SOA Infrastructure Common Properties page, accessible under SOA Administration in the SOA Infrastructure menu.
The following options are available:
-
Instances With Faults: Displays recent instances that have faults. This predefined search option is also available on the Flow Instances page, where you can select it from the Search Options list or click the Instances With Faults link.
-
All Saved Searches: Displays custom searches you have created and saved. Saved searches are also displayed in the Search region of the Dashboard page.
To execute predefined or custom fault instance searches:
At the top of the Search Options section, select the option for which to search.
The search results are displayed in the Fault Statistics table.
For more information about predefined fault instance searches, select Help > Help for This Page from the weblogic main menu on the Error Hospital page.
For information about saved searches, see Using the Report Filters Toolbar.
Using the Report Filters Toolbar
The Report Filters toolbar enables you to perform search-related tasks, such as resetting displayed fault search filter criteria, saving fault search filter criteria, and bookmarking searches. By default, only predefined searches can be invoked. You can extend the list of available searches by saving custom searches. The Report Filters toolbar displays in a sliding panel and may not be visible in the page at all times. If not already open, you can invoke it by clicking the large Search Options icon.
To use the Report Filters toolbar.
Go the toolbar in the Report Filters section.
The following options are available.
| Element | Description |
|---|---|
|
|
Click to reset the search fields in the currently invoked saved search to the last saved values. This is useful when you have modified a saved search and want to restart the query building process. |
|
|
Click to save your current search criteria. This saves both the selected search fields and their values, enabling you to run the identical search at a later time and view a fresh set of results. Searches are saved per user, and not globally. For example, user A cannot log in to Oracle Enterprise Manager Fusion Middleware Control and access the saved search criteria of user B. You must provide a name when saving a search. You cannot overwrite an existing saved search, but you can save it with a different name. You can delete the saved searches you created. To manage your saved searches, select All Saved Searches from the Report Filters list. |
|
|
Click to bookmark your current search criteria. A message is displayed with a URL containing the search parameters. Copy the URL to a browser bookmark window, email, or chat. The generated URL includes information about both the selected search fields and their values. This enables you to run the identical search at a later time and view a fresh set of results. |
For more information about the Report Filters toolbar, select Help > Help for This Page from the weblogic main menu on the Error Hospital page.
Viewing Aggregated Fault Statistics to Examine Fault Trends
The Fault Statistics table displays a report on faults data specified and created in either of the following ways:
-
Specified and created in the Report Filters section of the Error Hospital page.
-
Specified and created in the Search Options section and displayed in the Search Results table of the Flow Instances page, and then displayed in the Fault Statistics table by clicking the Error Hospital link above the Search Results table.
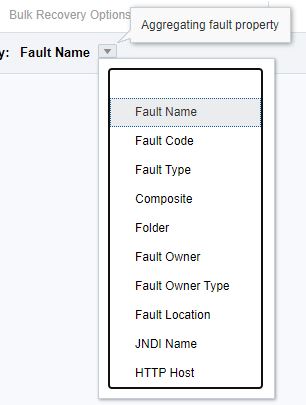
The data is always aggregated by one of the primary fault attributes selected from the Group By list, such as Fault Name, Fault Code, and so on. The default aggregation is by Fault Name.
The Error Hospital page does not show individual faulted instances. To track individual business flows that have faults, perform one of the following tasks:
-
Go to the Flow Instances page and click Instances With Faults.
-
Click a fault count in the Fault Statistics table of the Error Hospital page to access details about that fault in the Search Results table of the Flow Instances page.
The Fault Statistics table enables you to examine fault trends (such as for diagnostic purposes). For example, aggregate by Fault Code to see which code has the most faults. You can also perform bulk actions (recovery or abort) on a selected group of similar faults in a single operation.
To view aggregated fault statistics to examine fault trends:
-
Specify search criteria in the Report Filters section as described in Specifying and Saving Fault Search Criteria, and click Search.
The Fault Statistics table is populated with details about faults. This represents the total number of faults, faults requiring recovery, unrecoverable faults, recovered faults, and automatic fault retries.
The legend above the Fault Statistics table displays the color symbols used in the columns of the table to identify the state of faults.
State Description Nonrecoverable
Displays the total count of nonrecoverable faults. This includes failed and aborted faults.
Clicking the value in the column takes you to the Search Results table on the Flow Instances page and filters the list to show the flow instances associated with nonrecoverable faults. Terminal (fatal) faults cannot be recovered.
Recovery Required
Displays the total count of recoverable faults.
Clicking the value in the column takes you to the Search Results table on the Flow Instances page and filters the list to show the flow instances associated with recoverable faults. These are faults awaiting a human recovery action so that stuck flows can proceed.
Recovered
Displays the total count of recovered faults.
Clicking the value in the column takes you to the Search Results table on the Flow Instances page and filters the list to show flow instances associated with recovered faults. These are recoverable faults on which a recovery action was performed successfully. Processing has resumed in the business flow instance.
System Auto Retries
Displays the total count of faults that are automatically retried by the system.
Clicking the value in the column takes you to the Search Results table on the Flow Instances page and filters the list to show the flow instances associated with these system retried faults.
-
From the Group By list above the Fault Statistics table, select the fault attribute by which to aggregate data. Fault Name is the default aggregation field.
The following options are available:
Element Description Fault Name
Aggregates by the fault name. This aggregation option is selected by default.
Fault Code
Aggregates by the fault code.
Fault Type
Aggregates by the fault type:
-
System: Network errors or errors such as a database server or web service being unreachable.
-
Business: Application-specific faults generated when there is a problem with the information being processed (for example, a social security number is not found in the database).
-
OWSM: Errors on OWSM policies attached to SOA composite applications, service components, or binding components. Policies apply security to message delivery.
Composite
Aggregates by the SOA composite application name.
Folder
Aggregates by the SOA folder of the SOA composite application in which the fault occurred.
Fault Owner
Aggregates by the name of the service component, service binding component, or reference binding component that handled the fault. In some cases, this can be both the fault owner and fault location.
Fault Owner Type
Aggregates by the type of service component, service binding component, or reference binding component that handled the fault (for example, if a BPEL process service component owns the fault, BPEL is displayed).
JNDI Name
Aggregates by the JNDI name (for example, eis/FileAdapter).
HTTP Host
Aggregates by the HTTP host on which the fault occurred.
-
-
If you select Fault Code, each row in the first column represents a specific code and the remaining columns show the fault statistics aggregated for each code. Regardless of your selection, the remaining rows in the table always show the total number of faults; the number of recoverable, nonrecoverable, and currently recovered faults; and the number of automatic retries performed after a fault occurred.
-
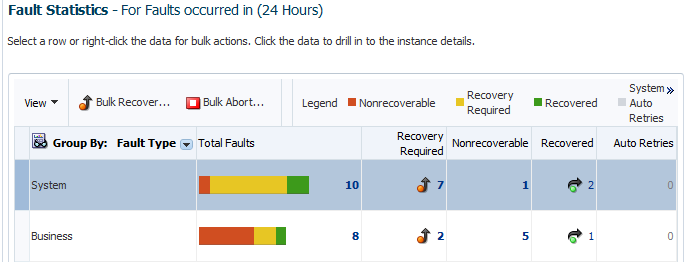
If you select Fault Type, each row in the first column represents a specific fault type and the remaining columns show the fault statistics aggregated for each type. As with all selections in the list, you can click the total, recoverable, and recovered numbers that are displayed to access the Flow Instances page for performing fault recovery actions.
-
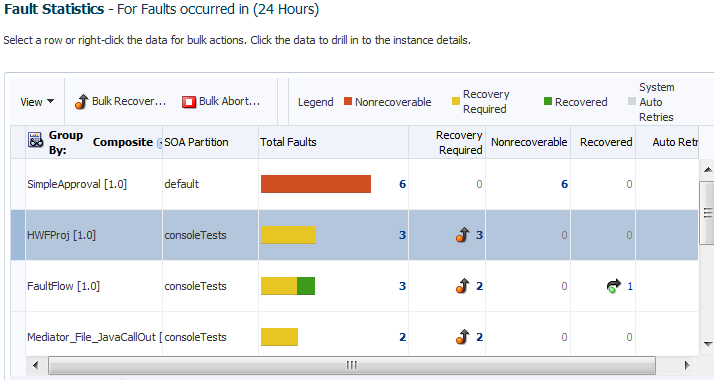
If you select Composite, each row in the first column represents a specific SOA composite application name and the remaining columns show the fault statistics aggregated for each composite.
Performing Bulk Fault Recoveries and Terminations in a Single Operation
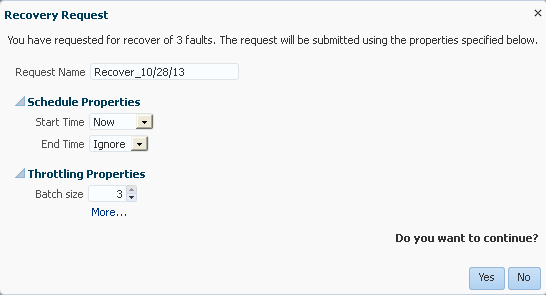
You can perform bulk fault recoveries and bulk fault terminations on any aggregated fault row in the Fault Statistics table that has recoverable faults. Options for performing these actions are displayed above the Fault Statistics table.
To perform bulk fault recoveries and terminations:
Using Additional Bulk Recovery Options for BPEL Processes
Depending on your fault policies, BPEL faults provide additional recovery options like Replay, Rethrow, and Continue. You can use these additional recovery options when bulk-recovering your BPEL faults.
Accessing Faults in the Fault Statistics Table to Perform Single Fault Recovery Operations
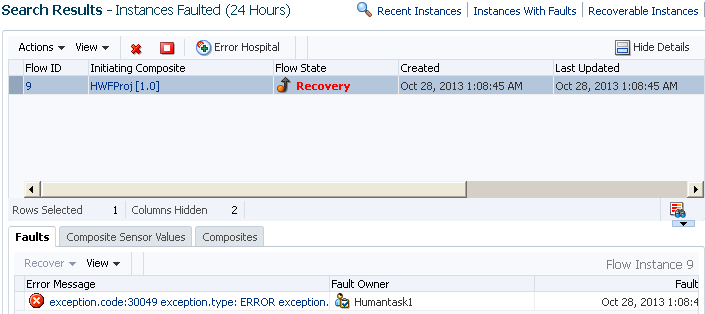
The Error Hospital page does not show individual faulted instances. However, you can click a fault count in the Fault Statistics table of the Error Hospital page to access that fault for performing single fault recovery operations in the Search Results table of the Flow Instances page.
To access faults in the Faults Statistics table to perform single fault recovery:
Understanding Additional Message and Fault Recovery Behavior Scenarios
This section describes additional fault message behavior issues on the Error Hospital page.
Recoverable Messages are Displayed as Unrecoverable in the Error Hospital
When message delivery fails on one node (the managed server) of a cluster, undelivered messages are displayed as follows:
-
Unrecoverable on the Error Hospital page
-
Recoverable on the BPEL process service engine Recovery page
This occurs when BPEL process invoke activities are processing during a server shutdown. These activities may not complete, even if a graceful shutdown occurs. In these cases, the instances are shown as running and unrecoverable on the Error Hospital page because the BPEL process service engine cannot update the business flow state during a server shutdown.
You can manually recover the BPEL invoke activities on the BPEL process service engine Recovery page. Otherwise, they are recovered during automatic recovery.
For more information, see Performing BPEL Process Service Engine Message Recovery.
Unrecoverable Binding Component Faults are Displayed as Recoverable
A FabricInvocationException.RetryType.NO_RETRY error returned by a database adapter reference binding component is treated as a binding fault. Even though the fault is nonretriable, the following is displayed:
-
There is a recoverable message on the BPEL process service engine Recovery page.
-
The flow state is displayed as recoverable because of the message in the BPEL process invoke activity recovery queue.
This is the expected behavior. In 12c, common faults and BPEL process messages are linked together. This means the fault and flow state both indicate that an invoke activity recovery is required.
For more information, see Performing BPEL Process Service Engine Message Recovery.
BPEL Process Messages Awaiting Recovery with no Associated Instance Faults Do Not Appear on the Error Hospital Page
If messages are awaiting recovery on the BPEL process service engine Recovery page and there is no associated fault with the instance, this is not shown on the Error Hospital page. This can occur in the following scenarios:
-
If a callback message arrives late and the instance has already completed.
-
If a race condition occurs when using message aggregation with
reenableAggregationOnComplete=true. When messages are sent around the same time, most of them are marked as midprocess receive messages and there are no new instances to pick them up.
For more information about message aggregation, see "Routing Messages to the Same Instance" of Developing SOA Applications with Oracle SOA Suite.
Creating Error Notification Rules
You can create error notification rules at the SOA Infrastructure or individual SOA folder level that cause an alert message to be triggered when specific fault criteria are met. For example, you can create a rule that sends an alert if more than 10 errors occur in a 48 hour period. You can configure the alert to be sent to the Fault Alerts section of the Dashboard page described in Viewing Error Notification Alerts. and also to a delivery channel such as an email address.
Note:
To create error notification rules, Oracle Enterprise Scheduler must be deployed to the SOA Infrastructure. If Oracle Enterprise Scheduler is not deployed, you cannot access this page.
The error notification rules provide the following benefits:
-
An aggregated notification of faults occurring in the system.
-
A scheduled-based notification system with a configurable reoccurrence interval. For example, send an alert every 24 hours if rule criteria are met.
-
Rule-configured faults and notification channel specifications. When a fault policy is triggered, an email is sent.
You can create fault notification rules at the following levels:
-
SOA Infrastructure (for system-wide alerts)
-
Individual SOA folder level (for alerts specific to that SOA folder)
The following roles are required for creating, updating, and deleting rules:
-
folder_nameApplicationOperator: This role is folder-specific. A user in this folder-specific role has the permissions to manage alerts for that SOA folder.
-
MiddlewareOperator
-
MiddlewareAdministrator
-
SOAAdmin
-
SOAOperator
For more information, see Securing Access to SOA Folders.
Note the following details about the display of rules in Oracle Enterprise Manager Fusion Middleware Control:
-
Rules created at the SOA Infrastructure (system-wide) level are not displayed in the Error Notification Rules page at the individual SOA folder level.
-
Rules created at the individual SOA folder level are not displayed in the Error Notification Rules page at the SOA Infrastructure (system-wide) level.
The Fault Alerts section of the SOA Infrastructure Dashboard page shows all system-wide alerts, including all SOA folders.
To create error notification rules:
-
To receive an alert notification when an error occurs, you must specify the address of the user and the delivery channel to use (email, IM, or SMS). Those tasks are performed on different pages in Oracle Enterprise Manager Fusion Middleware Control,
For This Delivery Channel... Perform These Tasks... Email
-
Configure the email addresses on the Workflow Notification Properties page.
-
When complete, click Go to the Messaging Driver page on the Workflow Notification Properties page.
-
Configure the email driver on the User Messaging Service page.
See Configuring the Email Driver in Administering Oracle User Messaging Service.
SMS
-
Configure the Short Message Peer-to-Peer (SMPP) driver on the User Messaging Service page.
See Configuring the SMPP Driver in Administering Oracle User Messaging Service.
IM
-
Configure the Extensible Messaging and Presence Protocol (XMPP) on the User Messaging Service page.
See Configuring the XMPP Driver in Administering Oracle User Messaging Service.
-
-
Create an alert at the appropriate level:
To create error notification rules at the SOA Infrastructure level:
From the SOA Infrastructure Menu... From the SOA Folder in the Navigator... -
Select Error Notification Rules.
-
Expand SOA.
-
Right-click soa-infra (server_name).
-
Select Error Notification Rules.
To create error notification rules at the individual SOA folder level:
From the SOA Folder Menu of a Specific Folder... From the SOA Folder in the Navigator... -
Select Error Notification Rules.
-
Right-click a specific SOA folder.
-
Select Error Notification Rules.
The Error Notification Rules page displays the following details:
-
An Error Notification Rules table for viewing existing rules and details about each rule. Select one or more rules to manage.
-
Links for creating a new rule, creating a new rule from an existing rule, editing a rule, deleting a rule, disabling a rule, and searching for a rule. For more information, click the weblogic icon and select Help > Help for This Page on the Error Notification Rules page.
-
-
Create a new rule in either of the following ways:
-
Click Create to create a new rule.
or
-
Click Create Like to create a new rule from a selected rule.
-
-
Enter the following information.
Element Description Name
Enter a name for the rule. Once the new rule is saved, the name cannot be changed. This name is also used for alerts that display on the Dashboard page or which are sent to the notification recipients through a channel such email, SMS, or instant messaging (IM).
Description
Enter a description for the rule. This description is visible only to administrators. An end user receiving fault notification alerts or viewing alerts on the Dashboard page cannot see this description.
Schedule Names
Select a predefined schedule. This indicates how often to trigger the scheduler (for example, invoke the scheduler every two minutes). When you select a schedule, the page is refreshed to display the Schedule Description and Frequency fields.
You define the schedule names in the Create Schedule page of Oracle Enterprise Manager Fusion Middleware Control.
-
In the Navigator, expand Scheduling Services > ESSAPP or right-click soa-infra (server_name) and select Define Schedules.
-
From the Scheduling Service menu, select Job Requests > Define Schedules.
The schedules available for selection in the Schedule Names list are displayed.
-
Click Create to create additional schedules and their execution frequency.
Note: While defining a schedule name, ensure that you specify the schedule package name of /oracle/apps/ess/custom/soa. Otherwise, the schedule is created, but is not accessible on the Create or Edit Error Notification Rule page.
For more information about using the Oracle Enterprise Scheduler in Oracle Enterprise Manager Fusion Middleware Control, see Administering Oracle Enterprise Scheduler.
Description.
Displays the schedule description configured on the Create Schedule page.
Frequency
Displays the schedule frequency configured on the Create Schedule page.
-
-
Use the IF-THEN table to define the fault notification rule, and click Apply.
Element Description IF
Define the IF part of the rule. At least one rule condition is mandatory, and cannot be removed.
-
At the SOA Infrastructure level, the mandatory parameter is:
Fault Occurred in Last
48Hours -
At the individual SOA folder level, the mandatory parameters are:
Fault Occurred in Last
48HoursFolder is folder_name
You can edit the default value of
48.Additional rule conditions are optional. Each condition can be added only once. Once a condition is added, it is removed from the list of available conditions.
Click the + sign to select rule conditions and assign values. For example, define a rule to trigger an alert if more than 3 faults occur in a 48 hour period in the default SOA folder.
IF Fault Occurred in Last
48Hours andFolder is
defaultandFault Count is over
3THEN
Define the THEN part of the rule. Any number of THEN conditions can be specified. At least one condition is required. (Send Alerts to Dashboard is a valid condition.)
-
Send Alerts to Dashboard
Select whether to send an alert to the Fault Alerts section of the Dashboard pages at the SOA Infrastructure or SOA folder levels when the specified fault criteria are met. Use this selection with care to prevent the Dashboard page from overflowing with fault alerts. If you do not select this option, the alert is not displayed on the Dashboard pages.
-
Send Message To User Via Delivery_Channel
Specify the address of the user to receive the alert notification and the delivery channel to use (email, IM, or SMS). Click the - sign to remove the users. It is your responsibility to ensure that the user contact information you enter is correct.
Note: You must also configure the notification email properties on the Workflow Notification Properties page, as described in Configuring Human Workflow Notification Properties. The delivery channels must also be configured in the Oracle UMS Adapter, which is accessible from the Workflow Notification Properties page by clicking the Go to the Messaging Driver page link.
The notification message the alert recipients receive provides the following details. The message content cannot be configured.
-
Fault information. For example:
16faultsoccurredinthelast48hours -
A link to the Error Hospital page for viewing details about the faults in this notification alert. From the Error Hospital page, you can drill down to see the individual flow instances and further details about the faults.
For information about configuring delivery channels in Oracle UMS Adapter, see Administering Oracle User Messaging Service.
When complete, alert notification rule design looks as follows.
By default, the alert is enabled. You can disable the alert by selecting the alert on the Edit Notification Rules page and clicking Disable. This button acts as a toggle for enabling or disabling one or more selected alerts.
When error notification rule criteria are met, the alert is triggered and displayed in the Fault Alerts section of the Dashboard page at the SOA Infrastructure or SOA folder level.
-
Click the link that identifies the number of faults.
The Error Hospital page is displayed.
-
Click Search.
The Fault Statistics table shows details about the faults and the Fault Occurred field of the Time filter of the Report Options section is populated with the same time period specified on the Create Error Notification Rules page.
-
In the Recoverable column, click the values to perform fault recovery. For more information, see Viewing Error Notification Alerts.
-
-
When you receive an error notification alert (for example, an email), click the link in the email to access the Error Hospital page.
16 Faults occurred in the last 48 hours
 Click the link for more details http://link_to_Error_Hospital_Page
For information about assigning alerts in the fault management framework in Oracle JDeveloper, see https://docs.oracle.com/pls/topic/lookup?ctx=en/middleware/soa-suite/soa/14.1.2/administer&id=SOASE88066 in Developing SOA Applications with Oracle SOA Suite.
For information about roles, see Securing Access to SOA Folders.
Error Notification Rules Associated with an Expired Schedule
You cannot enable, disable, or delete a rule when the schedule associated with the rule has expired. The following error message appears:
<Error> <oracle.soa.scheduler> <BEA-000000> <ESS-01054 Cannot hold request 5.
Current state is Finished.
oracle.as.scheduler.IllegalStateException: ESS-01054 Cannot hold request 5.
Current state is Finished.
at weblogic.rmi.internal.ServerRequest.sendReceive(ServerRequest.java:258)
at
weblogic.rmi.cluster.ClusterableRemoteRef.invoke(ClusterableRemoteRef.java:472
)
at
These actions can be performed if the rule has an active schedule.
