5 Monitoring Oracle Service Bus Service Health
This chapter describes how to monitor the health of your Service Bus projects and services using service health statistics. Statistics such as response times or message, error, and alert counts can help you detect, analyze, and fix any issues.
This chapter includes the following sections.
About Service Health Metrics
You can monitor statistics based on the current aggregation interval or monitor a running count of the statistics from the last time the statistics were reset. You can reset statistics at any time for the domain, for a project, or for a service.
When you display statistics based on the aggregation interval, you get a dynamic view of statistical data collected by each service with the aggregation interval determining the statistics that are displayed. For example, if the aggregation interval of a particular service is twenty minutes, that service's row displays the data collected in the last twenty minutes. For more information about the aggregation interval, see Introduction to Aggregation Intervals.
Service Health Metrics for Domains and Projects
When you view metrics for a domain or project, the statistics displayed are only a subset of the general metrics collected for each service. The statistics include aggregation interval, average response time, message count, error count, and alert count. Service health metrics are only displayed for services that have monitoring enabled.
The following table lists the metrics displayed for each type of service. For a complete list of statistics collected, see Statistics Collected for Oracle Service Bus.
Table 5-1 Oracle Service Bus Service Metrics
| Metric | Description |
|---|---|
|
Average Execution Time |
For a proxy service, the average of the time interval measured between receiving the message at the transport and either handling the exception or sending the response. For a business service, the average of the time interval measured between sending the message in the outbound transport and receiving an exception or a response. |
|
Total Number of Messages |
Number of messages sent to the service. In the case of JMS proxy services, if the transaction aborts due to an exception and places the message back in the queue so it is not lost, each retry dequeue is counted as a separate message. In the case of outbound transactions, each retry or failover is likewise counted as a separate message. |
|
Messages With Errors |
Number of messages with error responses. For a proxy service, it is the number of messages that resulted in an exit with the system error handler or an exit with a reply failure action. If the error is handled in the service itself with a reply with success or a resume action, it is not an error. For a business service, it is the number of messages that resulted in a transport error or a timeout. Retries and failovers are treated as separate messages. |
|
Success/Failure Ratio |
(Total Number of Messages - Number of Messages with Errors)/Messages with Errors |
|
Security |
Number of messages with WS-Security errors. This metric is calculated for both proxy services and business services. |
|
Validation |
Number of validation actions in the flow that failed. This metric only applies to proxy services and pipelines. |
Proxy Service Metrics
From a proxy service's Dashboard page, you can view the following types of metrics for the service:
-
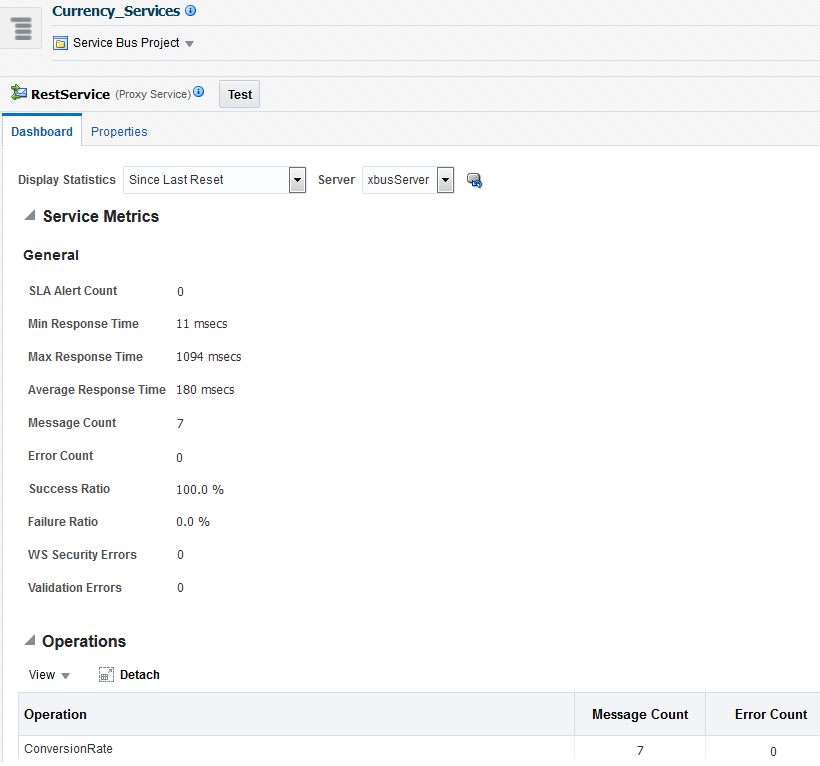
General: Displays a snapshot of the proxy service status for the current aggregation interval or since the last reset, including alerts, response times, message counts, error counts, and failure and success ratios.
-
Operations: Displays the statistics for operations defined for WSDL-based services. If there are no WSDL operations defined for the service, this table is empty.
Business Service Metrics
From a business service's Dashboard page, you can view the following types of metrics for the service:
-
General: Displays a snapshot of the business service status for the current aggregation interval or since the last reset, including alerts, response times, message counts, error counts, and failure and success ratios.
-
Result Caching: Displays information about how result caching has been used for the service (if result caching is enabled).
-
Throttling: Displays the throttling statistics for a business service, including the minimum, maximum, and average throttling times in milliseconds (if throttling is enabled).
-
Operations: Displays the statistics for operations defined for WSDL-based services. If there are no WSDL operations defined for the service, this table is empty.
-
Endpoint URIs: Displays statistics for the various endpoint URIs configured for a business service, including the state, message count, error count, and response times. You can also bring URIs online and offline from this view. For more information, see Viewing Endpoint URI Metrics for a Business Service and Metrics for Monitoring Endpoint URIs.
Pipeline Service Metrics
From a pipeline's Dashboard page, you can view the following types of metrics for the pipeline:
-
General: Displays a snapshot of the pipeline status for the current aggregation interval or since the last reset, including alerts, response times, message counts, and error counts.
-
Operations: Displays the statistics for operations defined for WSDL-based services. If there are no WSDL operations defined for the service, this table is empty.
-
Flow Metrics: Displays statistics for the message flow at the pipeline service level, pipeline (pair) level, or the action level, depending on the monitoring level for the pipeline. Statistics include message count, error count, and response times. When you select action-level statistics, the table displays information on actions in the pipeline as a hierarchy of nodes and actions.
Split-Join Service Metrics
From a split-join's Dashboard page, you can view the following types of metrics for the split-join:
-
General: Displays a snapshot of the split-join status for the current aggregation interval or since the last reset, including alerts, response times, message counts, and error counts.
-
Flow Metrics: Displays statistics for the message flow at the split-join level, branch level, or activity level, depending on the monitoring level for the split-join. The statistics include message count, error count, and response times. When you select action-level statistics, the table displays information on actions in the split-join as a hierarchy of nodes and actions.
Monitoring Service Health Statistics
The Service Health pages for Service Bus domains and projects display general metrics for services that have monitoring enabled. The Dashboard page for each service displays more detailed metrics for that service.
The Current Aggregation Interval view displays a moving statistic view of the service metrics. The Since Last Reset view displays a running count of the metrics. If a cluster exists, cluster-wide metrics are displayed by default. Select an individual Managed Server to display metrics for that server.
Monitoring for services is not enabled by default. To learn how to enable monitoring for services, see Viewing and Configuring Operational Settings. By default, the Dashboard refresh rate is No Refresh.
Viewing Statistics for the Services with the Most Errors
The Service Bus Dashboard displays certain statistics for services that have generated the most errors for the time period you select. The statistics include the average response time, the number of messages processed, the number of errors generated, and the number of SLA alerts generated for the service. This is a limited set of statistics; you can click a service name to view the complete set of statistics for that service.
For information about the statistics that appear on this page, see the online help provided with Service Bus.
To view statistics for the services with the most errors:
Viewing Service Health Statistics for a Domain
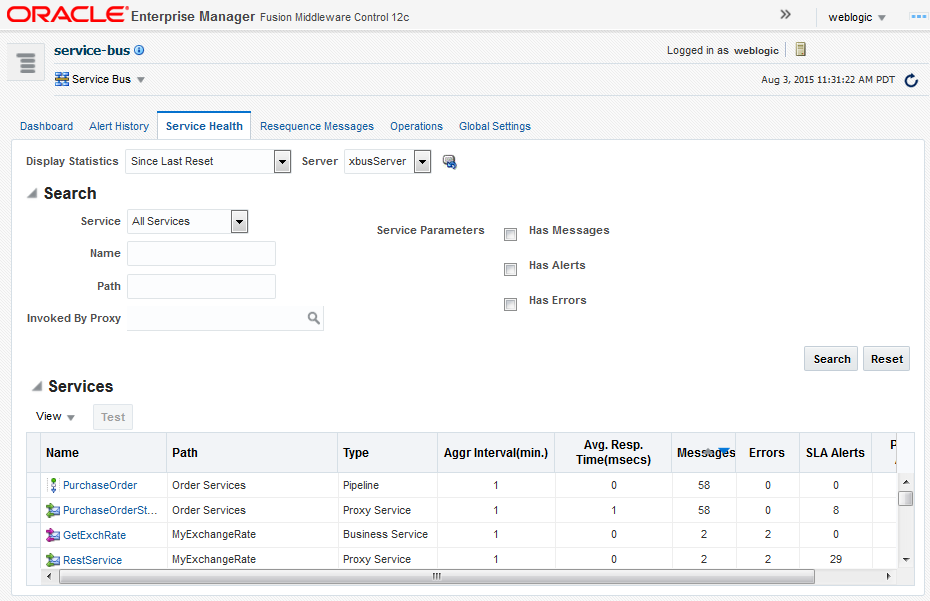
The Service Bus - Service Health page displays health statistics for all services in the domain that have monitoring enabled. This is a subset of all statistics; you can click a service name to view the complete set of statistics for that service. You can filter the services displayed in the Services table by a variety of criteria. The following figure shows the Service Health page.
To view statistics for all services in a Service Bus domain:
Viewing Service Health Statistics for a Project
The Service Bus Project - Service Health page displays health statistics for all services in the project that have monitoring enabled. This is a subset of all statistics; you can click a service name to view the complete set of statistics for that service. You can filter the services displayed in the Services table by a variety of criteria. The following figure shows the Dashboard page for a proxy service.
To view statistics for the services in a Service Bus project:
Viewing All Service Health Statistics for a Service
The Dashboard page for each Service Bus service displays the complete set of service metrics and service-specific statistics for that service, but only if monitoring is enabled for that service. You can access the Dashboard page for a service in several ways.
To view the complete set of health statistics for a service:
Resetting Statistics for Service Monitoring
You can use the Service Health page to reset monitoring statistics for all services in a domain or project, or just for one specific service.
When you reset statistics, the system deletes all monitoring statistics that were collected for the service, project, or domain since you last reset statistics. However, the system does not delete the statistics being collected during the current aggregation interval for the service. After a statistics reset, the system immediately starts collecting monitoring statistics for the service again.
Note:
If a split-join that gathers branch or activity level statistics is redeployed, the statistics should be reset to ensure that the displayed statistics match the current branches and activities.
To reset statistics for service monitoring:
Reset Option Fails to Reset Statistics
What You Might Need to Know About Resetting the Statistics
When you reset statistics for a service, all the statistics collected for the service since the last reset are lost. Resetting the statistics for the domain resets the statistics for all monitored services regardless of whether they are displayed on the page or not. You cannot undo a reset action. The status of endpoint URIs is not reset when you reset statistics.

