12 Integrating with Oracle Business Process Management
This chapter describes how Oracle Business Activity Monitoring (Oracle BAM) integrates Oracle Business Process Management (Oracle BPM). This integration captures BPM process metrics for analysis and display in BAM.
This chapter includes the following sections:
12.1 Understanding Oracle BAM and BPM Integration
When BAM and BPM are installed together and after process metrics are enabled, the BAM data objects for BPM are automatically created when BPM processes are deployed and populated with metric data as BPM processes run.
These data objects handle data from BPM, Case Management, and Human Workflow.
The data generated by BPM is used in pre-created process analytics reports. As a BAM designer you can also choose to include them into a custom BAM project.
For ready-to-use operational monitoring, BAM provides a set of pre-assembled dashboards in the default Process Analytics project.
Because each BPM process is unique, some instrumentation is required on the BPM side in BPM Composer or Oracle JDeveloper to capture the metric data in the BAM data objects. See "Using Process Analytics" in Developing Business Processes for Oracle Business Process Management for more information.
12.2 Configuring Cross-domain Communication for BAM, SOA, and BPM
Oracle BAM can communicate with Business Process Management across domains.
-
BPM and BAM domains are configured
-
Managed servers on both nodes are configured and have different names
-
The BAM server is still configured in the BPM (or SOA) domain, even if there is no data yet.
12.3 Enabling Process Metrics
This section outlines the procedure for enabling process metrics.
The steps for enabling BPM and Business Process Expression Language (BPEL) process metrics are the same.
Note:
If a BPM or BPEL process configured with measurements is deployed before enabling process metrics or while the Oracle BAM server is shut down, then all data published to BAM from such processes is disabled even if BAM is restarted later. This is because some mandatory artifacts required for runtime analytics cannot be created unless BAM is running. To allow such processes to publish data to BAM, redeploy them when BAM is running.
Performing process cubes migration before enabling process analytics is strongly recommended. See Migrate Process Cubes to BAM 12c Process Star Schema in Upgrading Oracle SOA Suite and Business Process Management for more information.
To enable process metrics:
12.4 Understanding the Pre-assembled BPM Dashboards
The pre-assembled dashboards in the Process Analytics project show common types of process analysis.
This section describes the dashboards and their component parts, including business views, business queries, and parameters. Understanding the Oracle BAM Data Objects for BPM describes the referenced data objects.
The Process Analytics Dashboards dashboard is directly under the Dashboards category in the navigator pane. All other pre-assembled dashboards are in the Process Analytics folder.
You can customize the metrics, queries, and views created for these dashboards for your company's specific needs.
See Creating Dashboards for details on how to create dashboards.
This section includes the following topics:
12.4.1 Process Analytics Dashboards Dashboard
The Process Analytics Dashboards dashboard links to all the other pre-assembled BPM dashboards except the BPM Process View dashboard. Each of the nine non-empty cells contains an image file and a dashboard link.
Figure 12-1 Process Analytics Dashboards Dashboard
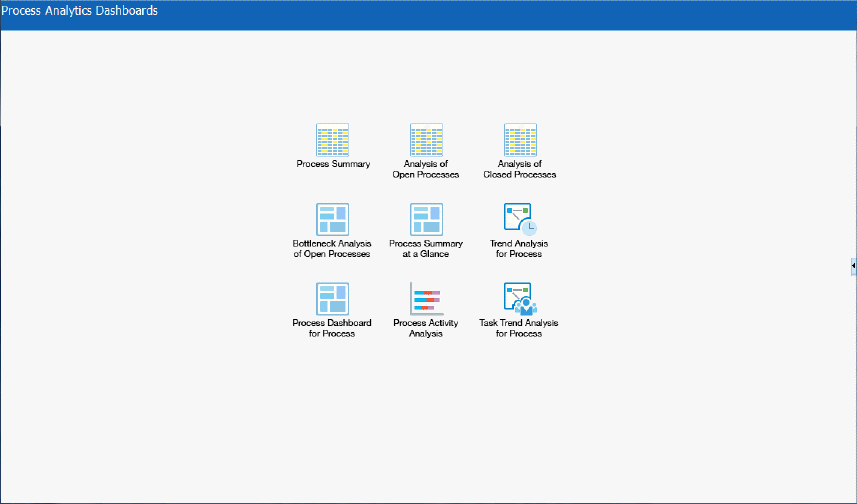
Description of "Figure 12-1 Process Analytics Dashboards Dashboard"
See Adding Other Content to Cells for information about how to add other content to dashboard cells, including images and links to other dashboards.
12.4.1.1 Data Visibility Rules for the Process Analytics Dashboards Dashboard
You can access dashboard data based on your assigned application role. Not all application roles are privy to all levels of data. Oracle BAM ships with the following application roles:
-
Process Owner: When a BPM composite is deployed, a corresponding process owner role <Composite Name>.ProcessOwner is automatically created in OracleBPMProcessRolesApp application stripe.
-
BPMProcessAdmin: A seeded application role in OracleBPMProcessRolesApp application stripe. The 'Administrators' group is a member of BPM ProcessAdmin application role.
-
BPMContentViewer: A seeded application role in the "BAMServer" application stripe.
-
Analytics viewer: When a BPM Composite with analytics enabled is deployed, a corresponding composite analytics viewer role <Composite Name>.AnalyticsViewer is automatically created in the "BAMServer" application stripe.
-
BAMAdministrator: A seeded application role in the "BAMServer" application stripe. The 'Administrators' group is a member of BAM Administrator application role.
Table 11-1 is depicts the data visibility for all dashboards for all memberships.
Table 12-1 Data Visibility Rules for BAM, BPM, and OOTB Process Analytics Dashboards Dashboard
| Membership | BAM Process View 12c Dashboard | BPM, BAM 12c OOTB Process Analytics Dashboards (Except Process View), AND Any Custom BAM 12c Dashboard using OOTB or Composite Specific Process Star Schema Logical DO. |
|---|---|---|
|
BPM Process Admin Application Role |
Can see all data |
Not relevant |
|
Composite's ProcessOwner Application Role |
Restricted to processes for which the user has the process owner role |
Not relevant |
|
BPM ContentViewer Application Role |
Not relevant |
Can see all data |
|
Composite's AnalyticsViewer Application Role |
Not relevant |
Restricted to processes for which the user has the corresponding Composite AnalyticsViewer role |
|
BAMAdministration Application Role |
Not relevant |
Can see all data |
|
Administrator Group |
Can see all data |
Can see all data |
|
All Other Authenticated Users |
No data shown |
No data shown |
12.4.2 Process Summary Dashboard
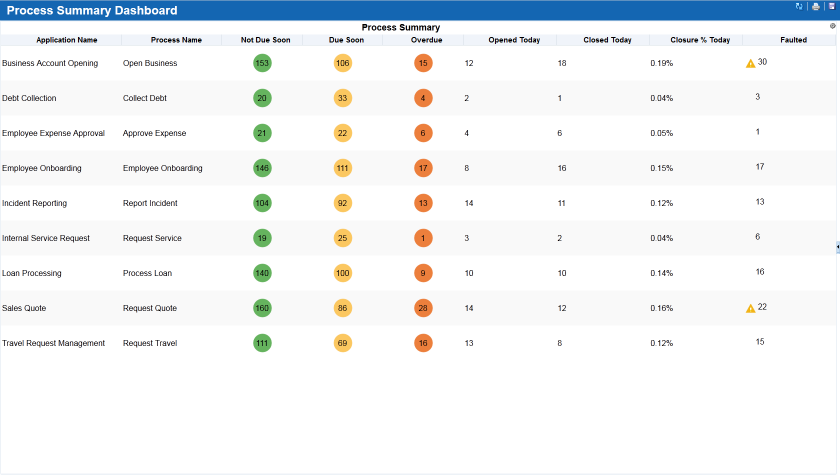
The Process Summary dashboard is a table display of all processes and their metrics for opened, closed, due soon, overdue, and faulted statuses. For due soon, overdue, and faulted statuses, graphics are displayed for values over 115, 18, and 20 process instances respectively.
The Title properties of the dashboard are Arial font, size 5, bold.
The Process Summary dashboard contains or references the following entities:
12.4.2.1 Process Summary View
The Process Summary view has the following characteristics and changes from default settings:
-
Type — Collapsed List
-
Query — see Process Summary Query
-
Thresholds properties:
-
SUMIS_OPN_NOT_DUE_SOON, 0-10000000, alta_green.png graphic -
SUMIS_DUE_SOON, 0-10000000, dark_yellow.png graphic -
SUMIS_OVERDUE, 0-10000000, alta_orange.png graphic -
SUMIS_FAULTED-
0–19, no graphic
-
19-10000000, warning.png graphic
-
-
-
Text properties:
-
Title Text —
Process Summary, Arial font, size 18, bold, center aligned -
Table Text — Arial font, size 16, center aligned
-
Column Header Text — Arial font, size 15, bold, center aligned
-
Column Header Display Text:
-
COMPOSITE_NAME—Application Name -
PROCESS_LABEL—Process Name -
SUMIS_OPENED_TODAY—Is Opened Today -
SUMIS_CLOSED_TODAY—Is Closed Today -
PERCENTOFTOTALIS_CLOSED—Closure % Today -
SUMIS_NOT_DUE_SOON—Open -
SUMIS_DUE_SOON—Due Soon -
SUMIS_OVERDUE—Overdue -
SUMIS_FAULTED—Faulted
-
-
PERCENTOFTOTAL(IS_CLOSED)has Format Field As set to Percentage
-
12.4.2.2 Process Summary Query
The Process Summary query has the following characteristics and changes from default settings:
-
Type — Group SQL Query
-
Data object — see Process Data Object
-
The following measures and aggregations are selected:
-
Is Opened Today, SUM
-
Is Closed Today, SUM
-
Is Open (and Not Due Soon), SUM
-
Is Overdue, SUM
-
Is Closed, PERCENTOFTOTAL
-
Is Due Soon, SUM
-
Is Faulted, SUM
-
-
The following dimensions are selected:
-
Composite Name
-
Process Display Name
-
12.4.3 Analysis of Open Processes Dashboard
The Analysis of Open Processes dashboard is a table display of open processes that compares average cycle time with current open time. For overdue processes and maximum process open times, graphics are displayed for values over 30 process instances and 23 days respectively.
Figure 12-3 Analysis of Open Processes Dashboard
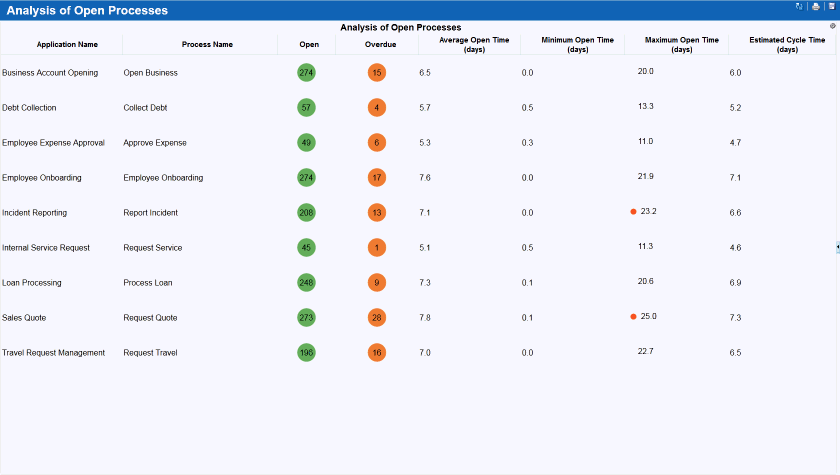
Description of "Figure 12-3 Analysis of Open Processes Dashboard"
The Title properties of the dashboard are Arial font, size 5, bold.
The Analysis of Open Processes dashboard contains or references the following entities:
12.4.3.1 Analysis of Open Processes View
The Analysis of Open Processes view has the following characteristics and changes from default settings:
-
Type — Collapsed List
-
Query — see Analysis of Open Instances Query
-
Thresholds properties:
-
SUMIS_OPEN, 0–10000000, alta_green.png graphic -
SUMIS_OVERDUE, 0–10000000, alta_orange.png graphic -
MAXPROCESS_OPEN_TIME_IN_DAYS-
0–23, no graphic
-
23–10000000, warning_circle_22x16.png graphic
-
-
-
Text properties:
-
Title Text —
Analysis of Open Processes, Arial font, size 18, bold, center aligned -
Table Text — Arial font, size 16, center aligned
-
Column Header Text — Arial font, size 15, bold, center aligned
-
Column Header Display Text:
-
COMPOSITE_NAME—Application Name -
PROCESS_LABEL—Process Name -
SUMIS_OPEN—Is Open -
SUMIS_OVERDUE—Is Overdue -
AVGESTIMATED_COMPLETE_TIME_DAYS—Estimated Cycle Time (days) -
AVGPROCESS_OPEN_TIME_IN_DAYS—Average Open Time (days) -
MINPROCESS_OPEN_TIME_IN_DAYS—Minimum Open Time (days) -
MAXPROCESS_OPEN_TIME_IN_DAYS—Maximum Open Time (days)
-
-
The following columns have Format Field As set to Number and No of Digits After Decimal set to 1:
-
AVG(ESTIMATED_COMPLETE_TIME_DAYS) -
AVG(PROCESS_OPEN_TIME_IN_DAYS) -
MIN(PROCESS_OPEN_TIME_IN_DAYS) -
MAX(PROCESS_OPEN_TIME_IN_DAYS)
-
-
12.4.3.2 Analysis of Open Instances Query
The Analysis of Open Instances query has the following characteristics and changes from default settings:
-
Type — Group SQL Query
-
Data object — see Process Data Object
-
The following measures and aggregations are selected:
-
Is Open, SUM
-
Is Overdue, SUM
-
Process Open Time in Days, AVG, MIN, MAX
-
Estimated Completion Time in Days, AVG
-
-
The following dimensions are selected:
-
Composite Name
-
Process Display Name
-
-
Filters — All are true branch:
-
IS_OPEN is equal to '1'
-
12.4.4 Analysis of Closed Processes Dashboard
The Analysis of Closed Processes dashboard is a table display that compares the current process cycle time and estimated cycle time with historical data, which you can filter by date.
Figure 12-4 Analysis of Closed Processes Dashboard
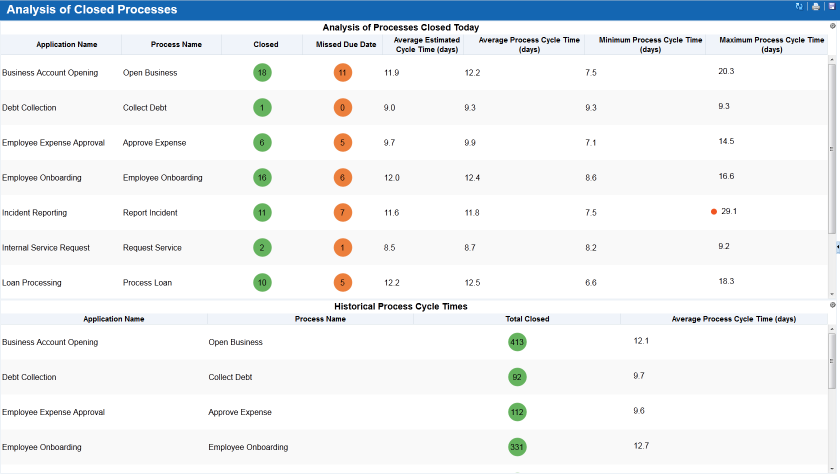
Description of "Figure 12-4 Analysis of Closed Processes Dashboard"
The Title properties of the dashboard are Arial font, size 5, bold.
The Analysis of Closed Processes dashboard contains or references the following entities:
12.4.4.1 Analysis of Processes Closed Today View
The Analysis of Processes Closed Today view has the following characteristics and changes from default settings:
-
Type — Collapsed List
-
Query — see Analysis of Instances Closed Today Query
-
Thresholds properties:
-
SUMIS_CLOSED, 0–10000000, alta_green.png graphic -
SUMMISSED_DUE_DATE, 0–10000000, alta_orange.png graphic -
MAXPROCESS_CYCLE_TIME_IN_DAYS-
0–25, no graphic
-
25–10000000, warning_circle_22x16.png graphic
-
-
-
Text properties:
-
Title Text —
Analysis of Closed Processes, Arial font, size 18, bold, center aligned -
Table Text — Arial font, size 16, center aligned
-
Column Header Text — Arial font, size 15, bold, center aligned
-
Column Header Display Text:
-
COMPOSITE_NAME—Application Name -
PROCESS_LABEL—Process Name -
SUMIS_CLOSED—Is Closed -
SUMMISSED_DUE_DATE—Missed Due Date -
AVGESTIMATED_COMPLETE_TIME_DAYS—Estimated Cycle Time (days) -
AVGPROCESS_CYCLE_TIME_IN_DAYS—Average Cycle Time (days) -
MINPROCESS_CYCLE_TIME_IN_DAYS—Minimum Cycle Time (days) -
MAXPROCESS_CYCLE_TIME_IN_DAYS—Maximum Cycle Time (days)
-
-
The following columns have Format Field As set to Number and No of Digits After Decimal set to 1:
-
AVG(ESTIMATED_COMPLETE_TIME_DAYS) -
AVG(PROCESS_CYCLE_TIME_IN_DAYS) -
MIN(PROCESS_CYCLE_TIME_IN_DAYS) -
MAX(PROCESS_CYCLE_TIME_IN_DAYS)
-
-
12.4.4.2 Historical Process Completion Times View
The Historical Process Completion Times view has the following characteristics and changes from default settings:
-
Type — Collapsed List
-
Query — see Historical Process Completion Times Query
-
Text properties:
-
Title Text —
Analysis of Closed Processes, Arial font, size 18, bold, center aligned -
Table Text — Arial font, size 16, center aligned
-
Column Header Text — Arial font, size 15, bold, center aligned
-
Column Header Display Text:
-
COUNTX—Total Closed -
COMPOSITE_NAME—Application Name -
PROCESS_LABEL—Process Name -
AVGPROCESS_CYCLE_TIME_IN_DAYS—Average Cycle Time (days)
-
-
The following columns have Format Field As set to Number and No of Digits After Decimal set to 1:
-
AVG(PROCESS_CYCLE_TIME_IN_DAYS)
-
-
12.4.4.3 Analysis of Instances Closed Today Query
The Analysis of Instances Closed Today query has the following characteristics and changes from default settings:
-
Type — Group SQL Query
-
Data object — see Process Data Object
-
The following measures and aggregations are selected:
-
Is Closed, SUM
-
Missed Due Date, SUM
-
Estimated Completion Time in Days, AVG
-
Process Cycle Time in Days, AVG, MIN, MAX
-
-
The following dimensions are selected:
-
Composite Name
-
Process Display Name
-
-
Filters — All are true branch:
-
IS_CLOSED_TODAY is equal to '1' -
PROCESS_INSTANCE_STATUS is equal to 'COMPLETED'
-
12.4.4.4 Historical Process Completion Times Query
The Historical Process Completion Times query has the following characteristics and changes from default settings:
-
Type — Group SQL Query
-
Data object — see Process Data Object
-
The following measures and aggregations are selected:
-
Process Cycle Time in Days, AVG
-
COUNT(*)
-
-
The following dimensions are selected:
-
Composite Name
-
Process Display Name
-
-
Filters — All are true branch:
-
PROCESS_END_TIME is greater than or equal to $Select data after -
PROCESS_END_TIME is less than or equal to $Select data before -
PROCESS_INSTANCE_STATUS is equal to 'COMPLETED'
See Select data after Parameter and Select data before Parameter
-
12.4.5 Bottleneck Analysis of Open Processes Dashboard
The Bottleneck Analysis of Open Processes dashboard is a treemap that uses size and color to identify long-running activities with high volume.
Figure 12-5 Bottleneck Analysis of Open Processes Dashboard
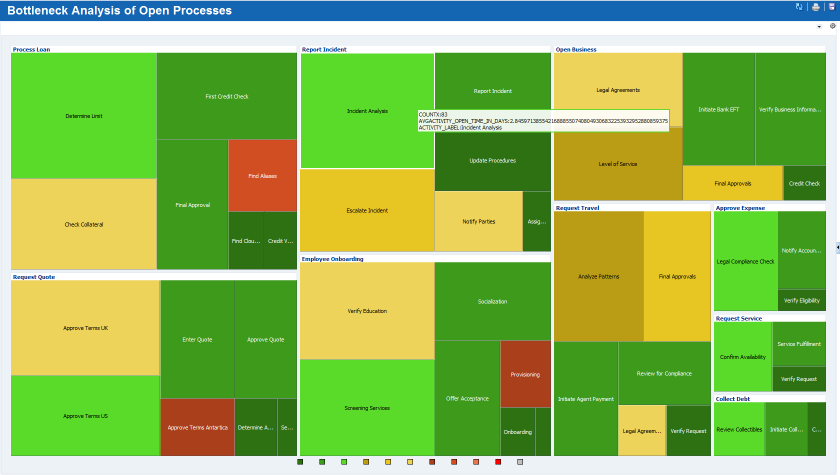
Description of "Figure 12-5 Bottleneck Analysis of Open Processes Dashboard"
The Title properties of the dashboard are Arial font, size 5, bold.
The Bottleneck Analysis of Open Processes dashboard contains or references the following entities:
12.4.5.1 Bottleneck Analysis of Open Processes View
The Bottleneck Analysis of Open Processes view has the following characteristics and changes from default settings:
-
Type — Treemap
-
Query — see Bottleneck Analysis of Open Processes Query
-
Value — COUNT(*)
-
Color — AVG(ACTIVITY_OPEN_TIME_IN_DAYS)
-
Title — (blank)
-
Color Thresholds properties:
-
0–1, 2d7113 hex color
-
1–2, 3d9a1b hex color
-
2–3, 5ada29 hex color
-
3–4, ba9d14 hex color
-
4–5, e7c624 hex color
-
5–6, edd35a hex color
-
6–7, a93f1b hex color
-
7–8, fefaf9 hex color
-
Overflow, e47752 hex color
-
12.4.5.2 Bottleneck Analysis of Open Processes Query
The Bottleneck Analysis of Open Processes query has the following characteristics and changes from default settings:
-
Type — Tree Model Query
-
Data object — see Activity Data Object
-
The following measures and aggregations are selected:
-
Activity Open Time in Days, AVG
-
COUNT(*)
-
-
Hierarchy — ProcessActivityHierarchy
-
Filters — All are true branch:
-
ACTIVITY_START_TIME is less than or equal to $Select data before -
ACTIVITY_START_TIME is greater than or equal to $Select data after -
ACTIVITY_INSTANCE_STATUS is equal to 'ACTIVE' -
ACTIVITY_OPEN_TIME_IN_HOURS is greater than or equal to '0'
See Select data before Parameter and Select data after Parameter
-
12.4.6 Process Summary at a Glance Dashboard
The Process Summary at a Glance dashboard is a treemap that uses size and color to show the number of active, completed, and faulted activities. You can filter the data by date.
Figure 12-6 Process Summary at a Glance Dashboard
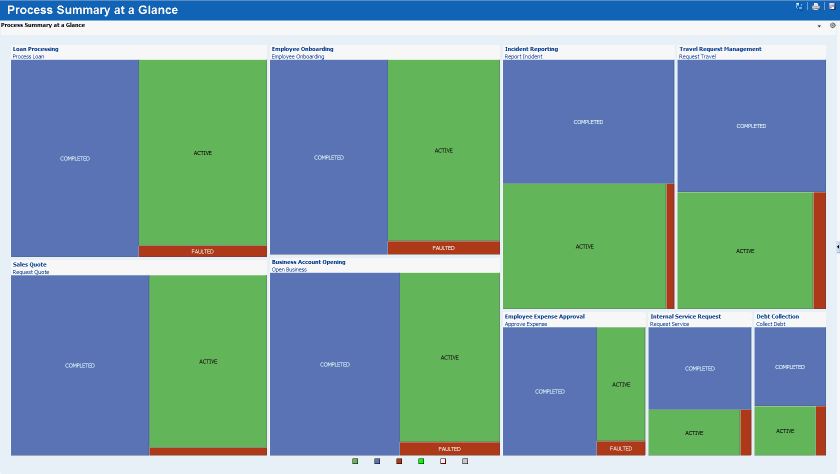
Description of "Figure 12-6 Process Summary at a Glance Dashboard"
The Title properties of the dashboard are Arial font, size 5, bold.
The Process Summary at a Glance dashboard contains or references the following entities:
12.4.6.1 Process Summary at a Glance View
The Process Summary at a Glance view has the following characteristics and changes from default settings:
-
Type — Treemap
-
Query — see Process Summary at a Glance Query
-
Value — COUNT(*)
-
Color — FirstInGroup(PROCESS_INSTANCE_STATUS_CODE)
-
Title —
Process Summary at a Glance, Arial font, 11 -
Color Thresholds properties:
-
0.5–1.5, 6db060 hex color
-
1.5–2.5, 587fb8 hex color
-
2.5–3.5, a93f1b hex color
-
12.4.6.2 Process Summary at a Glance Query
The Process Summary at a Glance query has the following characteristics and changes from default settings:
-
Type — Tree Model Query
-
Data object — see Process Data Object
-
The following measures and aggregations are selected:
-
Process Status Instance Code, FirstInGroup
-
COUNT(*)
-
-
Hierarchy — CompositeProcessStatusHierarchy
-
Filters — All are true branch:
-
PROCESS_END_TIME is less than or equal to $Select data before -
PROCESS_END_TIME is greater than or equal to $Select data after
See Select data before Parameter and Select data after Parameter
-
12.4.7 Trend Analysis for Processes Dashboard
The Trend Analysis for Processes dashboard is a set of line graphs that displays process cycle time, inflow, and outflow by day. You can filter the data by date and process.
Figure 12-7 Trend Analysis for Processes Dashboard
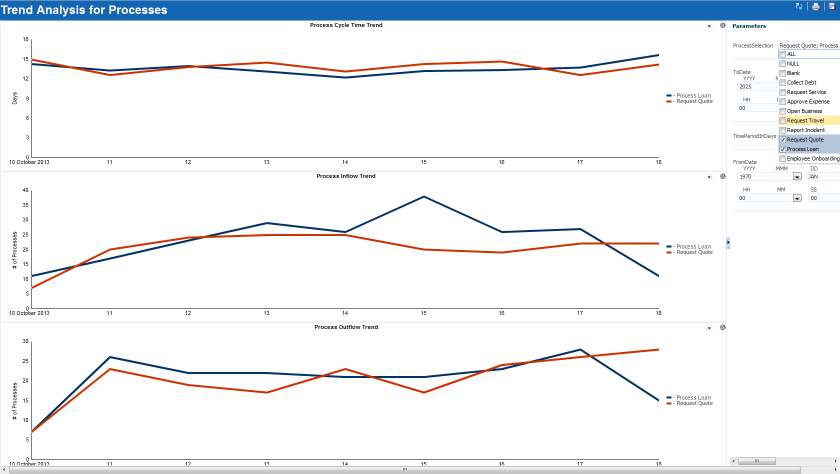
Description of "Figure 12-7 Trend Analysis for Processes Dashboard"
The Title properties of the dashboard are Arial font, size 5, bold.
The Trend Analysis for Processes dashboard contains or references the following entities:
12.4.7.1 Process Cycle Time Trend View
The Process Cycle Time Trend view has the following characteristics and changes from default settings:
-
Type — Line
-
Query — see Process Cycle Time Trend Query
-
Title properties:
-
Title Text —
Process Cycle Time Trend, Arial font, 11, center aligned
-
-
X-Axis properties:
-
Tick Label — Arial font, size 11
-
-
Y-Axis properties:
-
Title —
Days -
Tick Label — Arial font, size 11
-
-
Label Text:
-
PROCESS_END_TIME—End Date -
AVG(PROCESS_CYCLE_TIME_IN_DAYS)—'-'
-
12.4.7.2 Process Inflow Trend View
The Process Inflow Trend view has the following characteristics and changes from default settings:
-
Type — Line
-
Query — see Process Inflow Trend Query
-
Title properties:
-
Title Text —
Process Inflow Trend, Arial font, 11, center aligned
-
-
X-Axis properties:
-
Tick Label — Arial font, size 11
-
-
Y-Axis properties:
-
Title —
# of Processes -
Tick Label — Arial font, size 11
-
-
Label Text:
-
PROCESS_START_TIME—Start Date -
COUNT(*)—'-'
-
12.4.7.3 Process Outflow Trend View
The Process Outflow Trend view has the following characteristics and changes from default settings:
-
Type — Line
-
Query — see Process Outflow Trend Query
-
Title properties:
-
Title Text —
Process Outflow Trend, Arial font, 11, center aligned
-
-
X-Axis properties:
-
Tick Label — Arial font, size 11
-
-
Y-Axis properties:
-
Title —
# of Processes -
Tick Label — Arial font, size 11
-
-
Label Text:
-
PROCESS_END_TIME—End Date -
COUNT(*)—'-'
-
12.4.7.4 Process Cycle Time Trend Query
The Process Cycle Time Trend query has the following characteristics and changes from default settings:
-
Type — Group SQL Query
-
Data object — see Process Data Object
-
The following measures and aggregations are selected:
-
Process Cycle Time in Days, AVG
-
-
The following dimensions are selected:
-
Process End Time, Use Time Series, Time Unit Day, Quantity 1
-
-
Filters — All are true branch:
-
PROCESS_INSTANCE_STATUS is equal to 'COMPLETED' -
PROCESS_DEPLOYMENT_STATUS is equal to '1' -
DAYS_SINCE_PROCESS is less than or equal to $/Time Period (Days) -
DAYS_SINCE_PROCESS is greater than or equal to '0' -
PROCESS_END_TIME is less than or equal to $Select data before -
PROCESS_END_TIME is greater than or equal to $Select data after -
PROCESS_LABEL is equal to $Select a Process
See Time Period (Days) Parameter, Select data before Parameter, Select data after Parameter, and Select a Process Parameter
-
12.4.7.5 Process Inflow Trend Query
The Process Inflow Trend query has the following characteristics and changes from default settings:
-
Type — Group SQL Query
-
Data object — see Process Data Object
-
The following measures and aggregations are selected:
-
COUNT(*)
-
-
The following dimensions are selected:
-
Process Start Time, Use Time Series, Time Unit Day, Quantity 1
-
-
Legend — Process Display Name
-
Filters — All are true branch:
-
PROCESS_DEPLOYMENT_STATUS is equal to '1' -
DAYS_SINCE_PROCESS_START is less than or equal to $/Time Period (Days) -
DAYS_SINCE_PROCESS_START is greater than or equal to '0' -
PROCESS_START_TIME is less than or equal to $Select data before -
PROCESS_START_TIME is greater than or equal to $Select data after -
PROCESS_LABEL is equal to $Select a Process
See Time Period (Days) Parameter, Select data before Parameter, Select data after Parameter, and Select a Process Parameter
-
12.4.7.6 Process Outflow Trend Query
The Process Outflow Trend query has the following characteristics and changes from default settings:
-
Type — Group SQL Query
-
Data object — see Process Data Object
-
The following measures and aggregations are selected:
-
COUNT(*)
-
-
The following dimensions are selected:
-
Process End Time, Use Time Series, Time Unit Day, Quantity 1
-
-
Legend — Process Display Name
-
Filters — All are true branch:
-
PROCESS_INSTANCE_STATUS is equal to 'COMPLETED' -
PROCESS_DEPLOYMENT_STATUS is equal to '1' -
DAYS_SINCE_PROCESS is less than or equal to $/Time Period (Days) -
DAYS_SINCE_PROCESS is greater than or equal to '0' -
PROCESS_END_TIME is less than or equal to $Select data before -
PROCESS_END_TIME is greater than or equal to $Select data after -
PROCESS_LABEL is equal to $Select a Process
See Time Period (Days) Parameter, Select data before Parameter, Select data after Parameter, and Select a Process Parameter
-
12.4.8 Process Dashboard for Process Dashboard
The Process Dashboard for Process dashboard is a set of process metrics and a treemap that uses size and color to identify task assignees with high cycle time and large volume. You can filter the data by process.
Figure 12-8 Process Dashboard for Process Dashboard
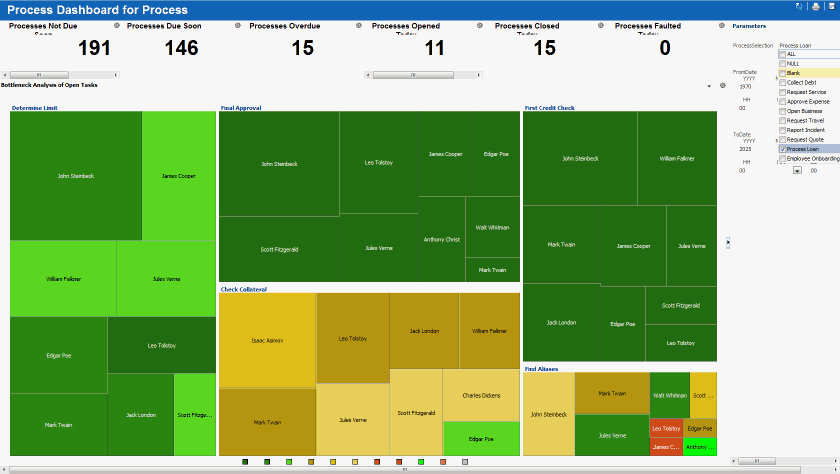
Description of "Figure 12-8 Process Dashboard for Process Dashboard"
The Title properties of the dashboard are Arial font, size 5, bold.
The Process Dashboard for Process dashboard contains or references the following entities:
12.4.8.1 Processes Opened Today Total View
The Processes Opened Today Total view has the following characteristics and changes from default settings:
-
Type — Collapsed List
-
Query — see Processes Opened Today Total Query
-
Text properties:
-
Title Text —
Processes Opened Today, Arial font, size 15, center aligned -
Table Text — Arial font, size 42, bold, center aligned
-
Column Header Visible — No
-
12.4.8.2 Processes Closed Today Total View
The Processes Closed Today Total view has the following characteristics and changes from default settings:
-
Type — Collapsed List
-
Query — see Processes Closed Today Total Query
-
Text properties:
-
Title Text —
Processes Closed Today, Arial font, size 15, center aligned -
Table Text — Arial font, size 42, bold, center aligned
-
Column Header Visible — No
-
12.4.8.3 Processes Faulted Today Total View
The Processes Faulted Today Total view has the following characteristics and changes from default settings:
-
Type — Collapsed List
-
Query — see Processes Faulted Today Total Query
-
Text properties:
-
Title Text —
Processes Faulted Today, Arial font, size 15, center aligned -
Table Text — Arial font, size 42, bold, center aligned
-
Column Header Visible — No
-
12.4.8.4 Processes Not Due Soon Total View
The Processes Not Due Soon Total view has the following characteristics and changes from default settings:
-
Type — Collapsed List
-
Query — see Processes Not Due Soon Total Query
-
Text properties:
-
Title Text —
Processes Open, Arial font, size 15, center aligned -
Table Text — Arial font, size 42, bold, center aligned
-
Column Header Visible — No
-
12.4.8.5 Processes Due Soon Total View
The Processes Due Soon Total view has the following characteristics and changes from default settings:
-
Type — Collapsed List
-
Query — see Processes Due Soon Total Query
-
Text properties:
-
Title Text —
Processes Due Soon, Arial font, size 15, center aligned -
Table Text — Arial font, size 42, bold, center aligned
-
Column Header Visible — No
-
12.4.8.6 Processes Overdue Total View
The Processes Overdue Total view has the following characteristics and changes from default settings:
-
Type — Collapsed List
-
Query — see Processes Overdue Total Query
-
Text properties:
-
Title Text —
Processes Overdue, Arial font, size 15, center aligned -
Table Text — Arial font, size 42, bold, center aligned
-
Column Header Visible — No
-
12.4.8.7 Bottleneck Analysis of Open Tasks View
The Bottleneck Analysis of Open Tasks view has the following characteristics and changes from default settings:
-
Type — Treemap
-
Query — see Bottleneck Analysis of Open Tasks Query
-
Value — COUNT(*)
-
Color — AVG(DAYS_SINCE_ASSIGNMENT)
-
Title —
Bottleneck Analysis of Open Tasks, Arial font, 11 -
Color Thresholds properties:
-
0–0.5, 2d7113 hex color
-
0.5–1.0, 3d9a1b hex color
-
1.0–1.5, 5ada29 hex color
-
1.5–2.0, ba9d14 hex color
-
2.0–2.5, e7c624 hex color
-
2.5–3.0, edd35a hex color
-
3.0–3.5, a93f1b hex color
-
3.5–4.0, fefaf9 hex color
-
Overflow, e47752 hex color
-
12.4.8.8 Processes Opened Today Total Query
The Processes Opened Today Total query has the following characteristics and changes from default settings:
-
Type — Group SQL Query
-
Data object — see Process Data Object
-
The following measures and aggregations are selected:
-
Is Opened Today, SUM
-
-
Filters — All are true branch:
-
PROCESS_LABEL is equal to $Select a Process
-
12.4.8.9 Processes Closed Today Total Query
The Processes Closed Today Total query has the following characteristics and changes from default settings:
-
Type — Group SQL Query
-
Data object — see Process Data Object
-
The following measures and aggregations are selected:
-
Is Closed Today, SUM
-
-
Filters — All are true branch:
-
PROCESS_LABEL is equal to $Select a Process
-
12.4.8.10 Processes Faulted Today Total Query
The Processes Faulted Today Total query has the following characteristics and changes from default settings:
-
Type — Group SQL Query
-
Data object — see Process Data Object
-
The following measures and aggregations are selected:
-
Is Faulted Today, SUM
-
-
Filters — All are true branch:
-
PROCESS_LABEL is equal to $Select a Process
-
12.4.8.11 Processes Not Due Soon Total Query
The Processes Not Due Soon Total query has the following characteristics and changes from default settings:
-
Type — Group SQL Query
-
Data object — see Process Data Object
-
The following measures and aggregations are selected:
-
Is Open and Not Due Soon, SUM
-
-
Filters — All are true branch:
-
PROCESS_LABEL is equal to $Select a Process
-
12.4.8.12 Processes Due Soon Total Query
The Processes Due Soon Total query has the following characteristics and changes from default settings:
-
Type — Group SQL Query
-
Data object — see Process Data Object
-
The following measures and aggregations are selected:
-
Is Due Soon, SUM
-
-
Filters — All are true branch:
-
PROCESS_LABEL is equal to $Select a Process
-
12.4.8.13 Processes Overdue Total Query
The Processes Overdue Total query has the following characteristics and changes from default settings:
-
Type — Group SQL Query
-
Data object — see Process Data Object
-
The following measures and aggregations are selected:
-
Is Overdue, SUM
-
-
Filters — All are true branch:
-
PROCESS_LABEL is equal to $Select a Process
-
12.4.8.14 Bottleneck Analysis of Open Tasks Query
The Bottleneck Analysis of Open Tasks query has the following characteristics and changes from default settings:
-
Type — Tree Model Query
-
Data object — see HWF Task Assignment Data Object
-
The following measures and aggregations are selected:
-
Days Since Assignment, AVG
-
COUNT(*)
-
-
Hierarchy — TaskAssignee
-
Filters — All are true branch:
-
ASSIGNMENT_STATE is equal to 'ASSIGNED' -
ASSIGNMENT_START_DATE is less than or equal to $Select data before -
ASSIGNMENT_START_DATE is greater than or equal to $Select data after -
DAYS_SINCE_ASSIGNMENT is greater than or equal to '0' -
PROCESS_LABEL is equal to $Select a Process
See Select data before Parameter, Select data after Parameter, and Select a Process Parameter
-
12.4.9 Process Activity Analysis Dashboard
The Process Activity Analysis dashboard is a set of task metrics and bar charts that shows the number of open, due soon, and overdue tasks by task or assignee. You can filter the data by process.
Figure 12-9 Process Activity Analysis Dashboard
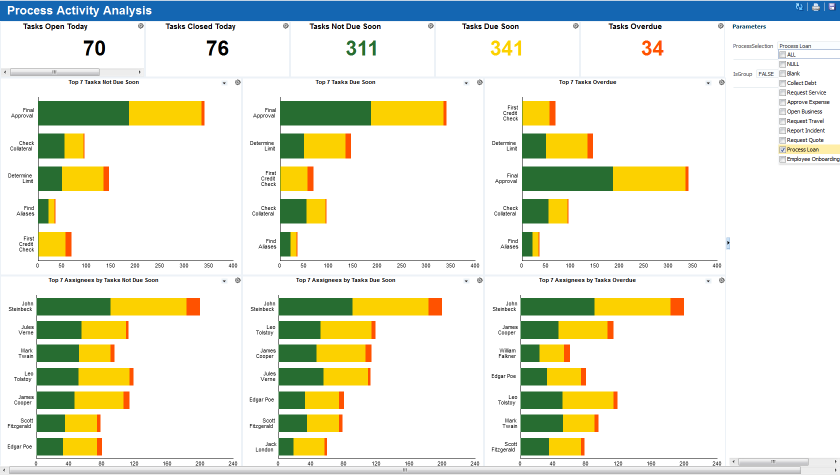
Description of "Figure 12-9 Process Activity Analysis Dashboard"
The Title properties of the dashboard are Arial font, size 5, bold.
The Process Activity Analysis dashboard contains or references the following entities:
12.4.9.1 Tasks Opened Today Total View
The Tasks Opened Today Total view has the following characteristics and changes from default settings:
-
Type — Collapsed List
-
Query — see Tasks Opened Today Total Query
-
Text properties:
-
Title Text —
Tasks Opened Today, Arial font, size 15, center aligned -
Table Text — Arial font, size 42, bold, center aligned
-
Column Header Visible — No
-
12.4.9.2 Tasks Closed Today Total View
The Tasks Closed Today Total view has the following characteristics and changes from default settings:
-
Type — Collapsed List
-
Query — see Tasks Closed Today Total Query
-
Text properties:
-
Title Text —
Tasks Closed Today, Arial font, size 15, center aligned -
Table Text — Arial font, size 42, bold, center aligned
-
Column Header Visible — No
-
12.4.9.3 Tasks Not Due Soon Total View
The Tasks Not Due Soon Total view has the following characteristics and changes from default settings:
-
Type — Collapsed List
-
Query — see Tasks Not Due Soon Total Query
-
Text properties:
-
Title Text —
Tasks Open, Arial font, size 15, center aligned -
Table Text — Arial font, size 42, bold, 276d31 hex color, center aligned
-
Column Header Visible — No
-
12.4.9.4 Tasks Due Soon Total View
The Tasks Due Soon Total view has the following characteristics and changes from default settings:
-
Type — Collapsed List
-
Query — see Tasks Due Soon Total Query
-
Text properties:
-
Title Text —
Tasks Due Soon, Arial font, size 15, center aligned -
Table Text — Arial font, size 42, bold, fcd100 hex color, center aligned
-
Column Header Visible — No
-
12.4.9.5 Tasks Overdue Total View
The Tasks Overdue Total view has the following characteristics and changes from default settings:
-
Type — Collapsed List
-
Query — see Tasks Overdue Total Query
-
Text properties:
-
Title Text —
Tasks Overdue, Arial font, size 15, center aligned -
Table Text — Arial font, size 42, bold, fcd100 hex color, center aligned
-
Column Header Visible — No
-
12.4.9.6 Tasks Not Due Soon View
The Tasks Not Due Soon view has the following characteristics and changes from default settings:
-
Type — Horizontal Bar
-
Query — see Tasks Not Due Soon Query
-
General properties:
-
Predefined Style — Green, Yellow, Red
-
-
Title properties:
-
Title Text —
Top 7 Tasks Within Due Date, Arial font, 11, bold, center aligned
-
-
X-Axis properties:
-
Tick Label — Arial font, size 11
-
-
Y-Axis properties:
-
Tick Label — Arial font, size 11
-
-
Legend properties:
-
Display Legend — No
-
12.4.9.7 Tasks Due Soon View
The Tasks Due Soon view has the following characteristics and changes from default settings:
-
Type — Horizontal Bar
-
Query — see Tasks Due Soon Query
-
General properties:
-
Predefined Style — Green, Yellow, Red
-
-
Title properties:
-
Title Text —
Top 7 Tasks Due Soon, Arial font, 11, bold, center aligned
-
-
X-Axis properties:
-
Tick Label — Arial font, size 11
-
-
Y-Axis properties:
-
Tick Label — Arial font, size 11
-
-
Legend properties:
-
Display Legend — No
-
12.4.9.8 Tasks Overdue View
The Tasks Overdue view has the following characteristics and changes from default settings:
-
Type — Horizontal Bar
-
Query — see Tasks Overdue Query
-
General properties:
-
Predefined Style — Green, Yellow, Red
-
-
Title properties:
-
Title Text —
Top 7 Tasks Overdue, Arial font, 11, bold, center aligned
-
-
X-Axis properties:
-
Tick Label — Arial font, size 11
-
-
Y-Axis properties:
-
Tick Label — Arial font, size 11
-
-
Legend properties:
-
Display Legend — No
-
12.4.9.9 Assignees Not Due Soon View
The Assignees Not Due Soon view has the following characteristics and changes from default settings:
-
Type — Horizontal Bar
-
Query — see Assignees Not Due Soon Query
-
General properties:
-
Predefined Style — Green, Yellow, Red
-
-
Title properties:
-
Title Text —
Top 7 Assignees by Tasks Within Due Date, Arial font, 11, bold, center aligned
-
-
X-Axis properties:
-
Tick Label — Arial font, size 11
-
-
Y-Axis properties:
-
Tick Label — Arial font, size 11
-
-
Legend properties:
-
Display Legend — No
-
12.4.9.10 Assignees Due Soon View
The Assignees Due Soon view has the following characteristics and changes from default settings:
-
Type — Horizontal Bar
-
Query — see Assignees Due Soon Query
-
General properties:
-
Predefined Style — Green, Yellow, Red
-
-
Title properties:
-
Title Text —
Top 7 Assignees by Tasks Due Soon, Arial font, 11, bold, center aligned
-
-
X-Axis properties:
-
Tick Label — Arial font, size 11
-
-
Y-Axis properties:
-
Tick Label — Arial font, size 11
-
-
Legend properties:
-
Display Legend — No
-
12.4.9.11 Assignees Overdue View
The Assignees Overdue view has the following characteristics and changes from default settings:
-
Type — Horizontal Bar
-
Query — see Assignees Overdue Query
-
General properties:
-
Predefined Style — Green, Yellow, Red
-
-
Title properties:
-
Title Text —
Top 7 Assignees by Tasks Overdue, Arial font, 11, bold, center aligned
-
-
X-Axis properties:
-
Tick Label — Arial font, size 11
-
-
Y-Axis properties:
-
Tick Label — Arial font, size 11
-
-
Legend properties:
-
Display Legend — No
-
12.4.9.12 Tasks Opened Today Total Query
The Tasks Opened Today Total query has the following characteristics and changes from default settings:
-
Type — Group SQL Query
-
Data object — see HWF Task Data Object
-
The following measures and aggregations are selected:
-
Is Opened Today, SUM
-
-
Filters — All are true branch:
-
PROCESS_LABEL is equal to $Select a Process
-
12.4.9.13 Tasks Closed Today Total Query
The Tasks Closed Today Total query has the following characteristics and changes from default settings:
-
Type — Group SQL Query
-
Data object — see HWF Task Data Object
-
The following measures and aggregations are selected:
-
Is Closed Today, SUM
-
-
Filters — All are true branch:
-
PROCESS_LABEL is equal to $Select a Process
-
12.4.9.14 Tasks Not Due Soon Total Query
The Tasks Not Due Soon Total query has the following characteristics and changes from default settings:
-
Type — Group SQL Query
-
Data object — see HWF Task Data Object
-
The following measures and aggregations are selected:
-
Is Open and not Due Soon, SUM
-
-
Filters — All are true branch:
-
PROCESS_LABEL is equal to $Select a Process
-
12.4.9.15 Tasks Due Soon Total Query
The Tasks Due Soon Total query has the following characteristics and changes from default settings:
-
Type — Group SQL Query
-
Data object — see HWF Task Data Object
-
The following measures and aggregations are selected:
-
Is Due Soon, SUM
-
-
Filters — All are true branch:
-
PROCESS_LABEL is equal to $Select a Process
-
12.4.9.16 Tasks Overdue Total Query
The Tasks Overdue Total query has the following characteristics and changes from default settings:
-
Type — Group SQL Query
-
Data object — see HWF Task Data Object
-
The following measures and aggregations are selected:
-
Is Overdue, SUM
-
-
Filters — All are true branch:
-
PROCESS_LABEL is equal to $Select a Process
-
12.4.9.17 Tasks Not Due Soon Query
The Tasks Not Due Soon query has the following characteristics and changes from default settings:
-
Type — Group SQL Query
-
Data object — see HWF Task Data Object
-
The following measures and aggregations are selected:
-
Is Open and not Due Soon, SUM
-
Is Due Soon, SUM
-
Is Overdue, SUM
-
-
Top N — 7, Apply on SUM(Is Open and not Due Soon)
-
The following dimensions are selected:
-
TITLE
-
-
Filters — All are true branch:
-
PROCESS_LABEL is equal to $Select a Process
-
12.4.9.18 Tasks Due Soon Query
The Tasks Due Soon query has the following characteristics and changes from default settings:
-
Type — Group SQL Query
-
Data object — see HWF Task Data Object
-
The following measures and aggregations are selected:
-
Is Open and not Due Soon, SUM
-
Is Due Soon, SUM
-
Is Overdue, SUM
-
-
Top N — 7, Apply on SUM(Is Due Soon)
-
The following dimensions are selected:
-
TITLE
-
-
Filters — All are true branch:
-
PROCESS_LABEL is equal to $Select a Process
-
12.4.9.19 Tasks Overdue Query
The Tasks Overdue query has the following characteristics and changes from default settings:
-
Type — Group SQL Query
-
Data object — see HWF Task Data Object
-
The following measures and aggregations are selected:
-
Is Open and not Due Soon, SUM
-
Is Due Soon, SUM
-
Is Overdue, SUM
-
-
Top N — 7, Apply on SUM(Is Overdue)
-
The following dimensions are selected:
-
TITLE
-
-
Filters — All are true branch:
-
PROCESS_LABEL is equal to $Select a Process
-
12.4.9.20 Assignees Not Due Soon Query
The Assignees Not Due Soon query has the following characteristics and changes from default settings:
-
Type — Group SQL Query
-
Data object — see HWF Task Assignment Data Object
-
The following measures and aggregations are selected:
-
Is Open and not Due Soon, SUM
-
Is Due Soon, SUM
-
Is Overdue, SUM
-
-
Top N — 7, Apply on SUM(Is Open and not Due Soon)
-
The following dimensions are selected:
-
ASSIGNEE_DISPLAY_NAME
-
-
Filters — All are true branch:
-
PROCESS_LABEL is equal to $Select a Process -
IS_GROUP is equal to $Assignee Is Group
See Select a Process Parameter and Assignee Is Group Parameter
-
12.4.9.21 Assignees Due Soon Query
The Assignees Due Soon query has the following characteristics and changes from default settings:
-
Type — Group SQL Query
-
Data object — see HWF Task Assignment Data Object
-
The following measures and aggregations are selected:
-
Is Open and not Due Soon, SUM
-
Is Due Soon, SUM
-
Is Overdue, SUM
-
-
Top N — 7, Apply on SUM(Is Due Soon)
-
The following dimensions are selected:
-
ASSIGNEE_DISPLAY_NAME
-
-
Filters — All are true branch:
-
PROCESS_LABEL is equal to $Select a Process -
IS_GROUP is equal to $Assignee Is Group
See Select a Process Parameter and Assignee Is Group Parameter
-
12.4.9.22 Assignees Overdue Query
The Assignees Overdue query has the following characteristics and changes from default settings:
-
Type — Group SQL Query
-
Data object — see HWF Task Assignment Data Object
-
The following measures and aggregations are selected:
-
Is Open and not Due Soon, SUM
-
Is Due Soon, SUM
-
Is Overdue, SUM
-
-
Top N — 7, Apply on SUM(Is Overdue)
-
The following dimensions are selected:
-
ASSIGNEE_DISPLAY_NAME
-
-
Filters — All are true branch:
-
PROCESS_LABEL is equal to $Select a Process -
IS_GROUP is equal to $Assignee Is Group
See Select a Process Parameter and Assignee Is Group Parameter
-
12.4.10 Task Trend Analysis for Process Dashboard
The Process Activity Analysis dashboard is a set of line graph is that displays task cycle time, inflow, and outflow by day. You can filter the data by date and process.
Figure 12-10 Task Trend Analysis for Process Dashboard
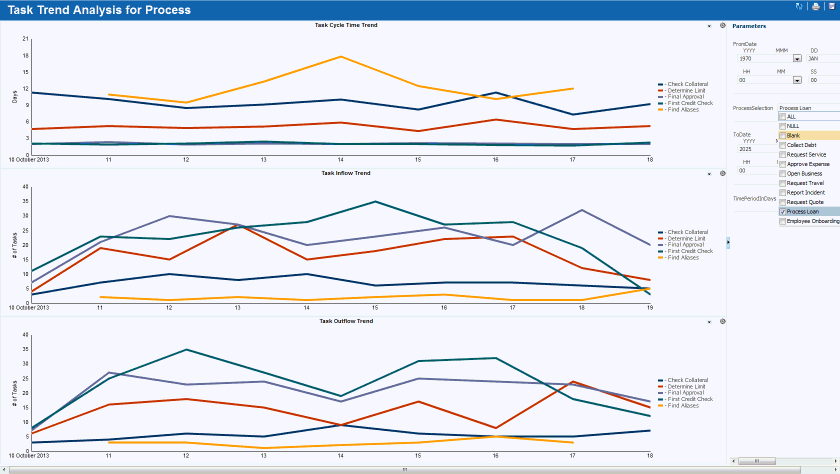
Description of "Figure 12-10 Task Trend Analysis for Process Dashboard"
The Title properties of the dashboard are Arial font, size 5, bold.
The Process Activity Analysis dashboard contains or references the following entities:
12.4.10.1 Task Cycle Time Trend View
The Task Cycle Time Trend view has the following characteristics and changes from default settings:
-
Type — Line
-
Query — see Task Cycle Time Trend Query
-
Title properties:
-
Title Text —
Task Cycle Time Trend, Arial font, 11, center aligned
-
-
X-Axis properties:
-
Tick Label — Arial font, size 11
-
-
Y-Axis properties:
-
Title —
Days -
Tick Label — Arial font, size 11
-
-
Label Text:
-
END_DATE—End Date -
AVG(TASK_TOTAL_TIME_IN_DAYS)—'-'
-
12.4.10.2 Task Inflow Trend View
The Task Inflow Trend view has the following characteristics and changes from default settings:
-
Type — Line
-
Query — see Task Inflow Trend Query
-
Title properties:
-
Title Text —
Task Inflow Trend, Arial font, 11, center aligned
-
-
X-Axis properties:
-
Tick Label — Arial font, size 11
-
-
Y-Axis properties:
-
Title —
# of Tasks -
Tick Label — Arial font, size 11
-
-
Label Text:
-
START_DATE—Start Date -
COUNT(*)—'-'
-
12.4.10.3 Task Outflow Trend View
The Task Outflow Trend view has the following characteristics and changes from default settings:
-
Type — Line
-
Query — see Task Outflow Trend Query
-
Title properties:
-
Title Text —
Task Outflow Trend, Arial font, 11, center aligned
-
-
X-Axis properties:
-
Tick Label — Arial font, size 11
-
-
Y-Axis properties:
-
Title —
# of Tasks -
Tick Label — Arial font, size 11
-
-
Label Text:
-
END_DATE—End Date -
COUNT(*)—'-'
-
12.4.10.4 Task Cycle Time Trend Query
The Task Cycle Time Trend query has the following characteristics and changes from default settings:
-
Type — Group SQL Query
-
Data object — see HWF Task Data Object
-
The following measures and aggregations are selected:
-
Task Total Time in Days, AVG
-
-
The following dimensions are selected:
-
END_DATE, Use Time Series, Time Unit Day, Quantity 1
-
-
Legend — TITLE
-
Filters — All are true branch:
-
TASK_STATE is equal to 'COMPLETED' -
DAYS_SINCE_TASK is less than or equal to $/Time Period (Days) -
DAYS_SINCE_TASK is greater than or equal to '0' -
END_DATE is less than or equal to $Select data before -
END_DATE is greater than or equal to $Select data after -
PROCESS_LABEL is equal to $Select a Process
See Time Period (Days) Parameter, Select data before Parameter, Select data after Parameter, and Select a Process Parameter
-
12.4.10.5 Task Inflow Trend Query
The Task Inflow Trend query has the following characteristics and changes from default settings:
-
Type — Group SQL Query
-
Data object — see HWF Task Data Object
-
The following measures and aggregations are selected:
-
COUNT(*), AVG
-
-
The following dimensions are selected:
-
START_DATE, Use Time Series, Time Unit Day, Quantity 1
-
-
Legend — TITLE
-
Filters — All are true branch:
-
DAYS_SINCE_TASK is less than or equal to $/Time Period (Days) -
DAYS_SINCE_TASK is greater than or equal to '0' -
END_DATE is less than or equal to $Select data before -
END_DATE is greater than or equal to $Select data after -
PROCESS_LABEL is equal to $Select a Process
See Time Period (Days) Parameter, Select data before Parameter, Select data after Parameter, and Select a Process Parameter
-
12.4.10.6 Task Outflow Trend Query
The Task Outflow Trend query has the following characteristics and changes from default settings:
-
Type — Group SQL Query
-
Data object — see HWF Task Data Object
-
The following measures and aggregations are selected:
-
COUNT(*), AVG
-
-
The following dimensions are selected:
-
END_DATE, Use Time Series, Time Unit Day, Quantity 1
-
-
Legend — TITLE
-
Filters — All are true branch:
-
TASK_STATE is equal to 'COMPLETED' -
DAYS_SINCE_TASK is less than or equal to $/Time Period (Days) -
DAYS_SINCE_TASK is greater than or equal to '0' -
END_DATE is less than or equal to $Select data before -
END_DATE is greater than or equal to $Select data after -
PROCESS_LABEL is equal to $Select a Process
See Time Period (Days) Parameter, Select data before Parameter, Select data after Parameter, and Select a Process Parameter
-
12.4.11 BPM Process View Dashboard
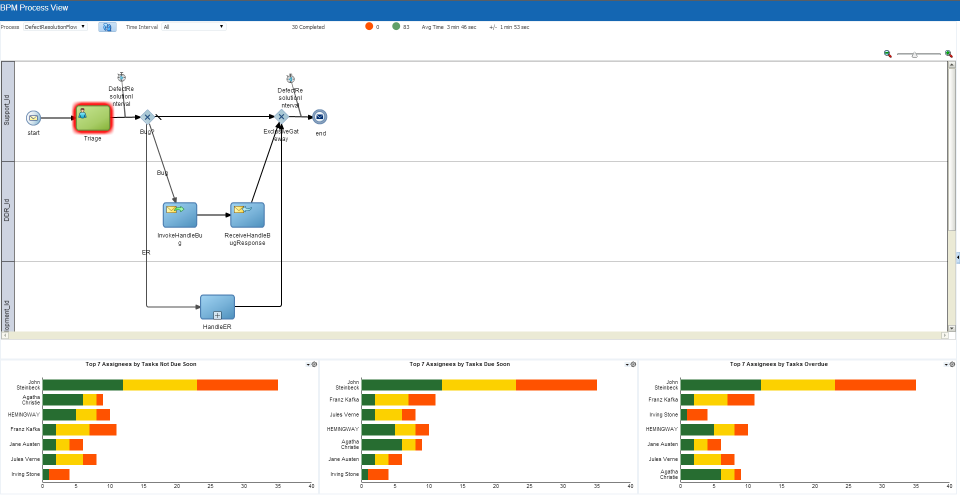
The BPM Process View dashboard displays a BPM process along with corresponding metrics and bottleneck analysis. It also includes bar charts with the number of open, due soon, and overdue tasks for assignees.
The Title properties of the dashboard are Arial font, size 5, bold.
In the Parameter Mapping Editor, the PROCESS_NAME field in the BPM process drives values of the Process Name parameters in the other views. See Driving Parameters from Other Views and Process Name Parameter.
The BPM Process View dashboard contains or references the following entities:
12.4.11.1 Assignees Not Due Soon PV View
The Assignees Not Due Soon view has the following characteristics and changes from default settings:
-
Type — Horizontal Bar
-
Query — see Assignees Not Due Soon PV Query
-
General properties:
-
Predefined Style — Green, Yellow, Red
-
-
Title properties:
-
Title Text —
Top 7 Assignees Within Due Date, Arial font, 11, bold, center aligned
-
-
X-Axis properties:
-
Tick Label — Arial font, size 11
-
-
Y-Axis properties:
-
Tick Label — Arial font, size 11
-
-
Legend properties:
-
Display Legend — No
-
12.4.11.2 Assignees Due Soon PV View
The Assignees Due Soon view has the following characteristics and changes from default settings:
-
Type — Horizontal Bar
-
Query — see Assignees Due Soon PV Query
-
General properties:
-
Predefined Style — Green, Yellow, Red
-
-
Title properties:
-
Title Text —
Top 7 Assignees Due Soon, Arial font, 11, bold, center aligned
-
-
X-Axis properties:
-
Tick Label — Arial font, size 11
-
-
Y-Axis properties:
-
Tick Label — Arial font, size 11
-
-
Legend properties:
-
Display Legend — No
-
12.4.11.3 Assignees Overdue PV View
The Assignees Overdue view has the following characteristics and changes from default settings:
-
Type — Horizontal Bar
-
Query — see Assignees Overdue PV Query
-
General properties:
-
Predefined Style — Green, Yellow, Red
-
-
Title properties:
-
Title Text —
Top 7 Assignees Overdue, Arial font, 11, bold, center aligned
-
-
X-Axis properties:
-
Tick Label — Arial font, size 11
-
-
Y-Axis properties:
-
Tick Label — Arial font, size 11
-
-
Legend properties:
-
Display Legend — No
-
12.4.11.4 Assignees Not Due Soon PV Query
The Assignees Not Due Soon PV query has the following characteristics and changes from default settings:
-
Type — Group SQL Query
-
Data object — see HWF Task Assignment Data Object
-
The following measures and aggregations are selected:
-
Is Open and not Due Soon, SUM
-
Is Due Soon, SUM
-
Is Overdue, SUM
-
-
Top N — 7, Apply on SUM(Is Open and not Due Soon)
-
The following dimensions are selected:
-
ASSIGNEE_DISPLAY_NAME
-
-
Filters — All are true branch:
-
PROCESS_LABEL is equal to $Process Name -
IS_GROUP is equal to $Assignee Is Group
-
12.4.11.5 Assignees Due Soon PV Query
The Assignees Due Soon PV query has the following characteristics and changes from default settings:
-
Type — Group SQL Query
-
Data object — see HWF Task Assignment Data Object
-
The following measures and aggregations are selected:
-
Is Open and not Due Soon, SUM
-
Is Due Soon, SUM
-
Is Overdue, SUM
-
-
Top N — 7, Apply on SUM(Is Due Soon)
-
The following dimensions are selected:
-
ASSIGNEE_DISPLAY_NAME
-
-
Filters — All are true branch:
-
PROCESS_LABEL is equal to $Process Name -
IS_GROUP is equal to $Assignee Is Group
-
12.4.11.6 Assignees Overdue PV Query
The Assignees Overdue PV query has the following characteristics and changes from default settings:
-
Type — Group SQL Query
-
Data object — see HWF Task Assignment Data Object
-
The following measures and aggregations are selected:
-
Is Open and not Due Soon, SUM
-
Is Due Soon, SUM
-
Is Overdue, SUM
-
-
Top N — 7, Apply on SUM(Is Overdue)
-
The following dimensions are selected:
-
ASSIGNEE_DISPLAY_NAME
-
-
Filters — All are true branch:
-
PROCESS_LABEL is equal to $Process Name -
IS_GROUP is equal to $Assignee Is Group
-
12.4.12 BPM Dashboard Parameters
Multiple queries in the preassembled BPM dashboards use the same parameters.
This section includes the following topics:
12.4.12.1 Assignee Is Group Parameter
The Assignee Is Group parameter has the following characteristics and changes from default settings:
-
Type — List
-
Data type —
VARCHAR -
Required — Yes
-
Data object — /oracle/processanalytics/internal/physical/HWF Assignment (physical)
-
Field —
IS_GROUP -
Value Options —
FALSE,TRUE -
Choose values — Yes
-
Multiple values — Yes
-
Default —
FALSE
12.4.12.2 Process Name Parameter
The Process Name parameter has the following characteristics and changes from default settings:
-
Type — Value
-
Data type —
VARCHAR -
Required — Yes
-
Default — Input value,
ALL
12.4.12.3 Select a Process Parameter
The Select a Process parameter has the following characteristics and changes from default settings:
-
Type — List
-
Data type —
VARCHAR -
Required — Yes
-
Data object — /oracle/processanalytics/internal/physical/Process Definition
-
Field —
PROCESS_LABEL -
Special Options —
ALL -
Multiple values — Yes
-
Default —
Process Loan
12.4.12.4 Select data after Parameter
The Select data after parameter has the following characteristics and changes from default settings:
-
Type — Value
-
Data type —
DATETIME -
Required — Yes
-
Default — Input value,
1/1/1970 12:00 AM
12.4.12.5 Select data before Parameter
The Select data before parameter has the following characteristics and changes from default settings:
-
Type — Value
-
Data type —
DATETIME -
Required — Yes
-
Default — Input value,
1/1/2025 12:00 AM
12.5 Understanding the Oracle BAM Data Objects for BPM
All the BAM data objects for BPM are included in the default Process Analytics project in the Designer page.
To view information about a BAM data object while in either the Designer or Administration page, first click the arrow to the left of Data Objects in the left navigation pane. Open any folders in the same manner. Then do one of the following:
-
Click the data object name.
-
Select the data object icon and click the Edit icon.
-
Right-click the data object name or icon, and select the Edit from the menu.
All the BAM data objects for BPM are in the /oracle/processanalytics folder, arranged as follows:
-
Activity
-
Process
-
HWF Task
-
HWF Task Assignment
-
internal (folder)
-
Activity Definition
-
BPM Activity (Secured)
-
BPM Process (Secured)
-
Composite Definition
-
Process Definition
-
Role Definition
-
physical (folder)
-
Activity (physical)
-
Activity Definition (physical)
-
Composite Definition
-
HWF Assignment (physical)
-
HWF Task Definition
-
Process (physical)
-
Process Definition
-
Role Definition (physical)
-
-
All data objects in the physical folder are simple data objects. All other data objects under /oracle/processanalytics are logical data objects.
Note:
It is strongly recommended that you do not change any data objects in the oracle folder. Doing so could break dependent entities such as the preassembled BPM dashboards and other Oracle samples.
The top-level logical data objects are referenced by the preassembled BPM dashboards and are described in these sections:
Because the columns in these data objects are so numerous, only the calculated fields are listed. To display column information for a data object, see Viewing Data Object Information and The Columns Tab.
For general information about data objects, see Working with Data Objects and Creating and Managing Oracle BAM Data Objects.
12.5.1 Process Data Object
The Process data object has the following characteristics:
-
Type — Logical Data Object
-
Full name — /oracle/processanalytics/Process
-
Referenced data objects:
-
/oracle/processanalytics/internal/physical/Process
-
/oracle/processanalytics/internal/physical/Process Definition
-
/oracle/processanalytics/internal/physical/Composite Definition
-
-
Hierarchies:
-
CompositeProcessStatusHierarchy — Composite Name, Process Display Name, Process Instance Status
-
CompositeProcessHierarchy — Composite Name, Process Display Name
-
-
Calculated fields:
-
IS_OPENED_TODAY—if((DAYOFYEAR({Process Start Time})==DAYOFYEAR(NOW()))&&(YEAR({Process Start Time})==YEAR(NOW())))then(1)else(0) -
IS_CLOSED_TODAY—if((DAYOFYEAR({Process End Time})==DAYOFYEAR(NOW()))&&(YEAR({Process End Time})==YEAR(NOW()))&&({Process Instance Status}=="COMPLETED"))then(1)else(0) -
IS_FAULTED_TODAY—if((DAYOFYEAR({Process End Time})==DAYOFYEAR(NOW()))&&(YEAR({Process End Time})==YEAR(NOW()))&&({Process Instance Status}=="FAULTED"))then(1)else(0) -
IS_OPEN—if({Process Instance Status}=="ACTIVE")then(1)else(0) -
IS_CLOSED—if({Process Instance Status}=="COMPLETED")then(1)else(0) -
IS_FAULTED—if({Process Instance Status}=="FAULTED")then(1)else(0) -
IS_OPEN_NOT_DUE_SOON—if(({Process Instance Status}=="ACTIVE")&&(DATEDIFF(SQL_TSI_DAY,NOW(),{Process Due Time}))>5)then(1)else(0) -
IS_DUE_SOON—if(({Process Instance Status}=="ACTIVE")&&({Process Due Time}>NOW())&&(DATEDIFF(SQL_TSI_DAY,NOW(),{Process Due Time}))<=5)then(1)else(0) -
IS_OVERDUE—if(({Process Instance Status}=="ACTIVE")&&({Process Due Time}<NOW()))then(1)else(0) -
MISSED_DUE_DATE—if(({Process Instance Status}=="ACTIVE")&&({Process Due Time}<NOW()))then(1)else(if({Process Instance Status}=="COMPLETED")&&(({Process Due Time}<{Process End Time}))then(1)else(0)) -
PROCESS_CYCLE_TIME_IN_HOURS—{Process Running Time (millisecs)}/3600000 -
PROCESS_CYCLE_TIME_IN_DAYS—{Process Running Time (millisecs)}/86400000 -
PROCESS_OPEN_TIME_IN_HOURS—DATEDIFF(SQL_TSI_SECOND,{Process Start Time},NOW())/3600 -
ESTIMATED_COMPLETE_TIME_DAYS—IF({Process Estimated Time}!=NULL)THEN(DATEDIFF(SQL_TSI_DAY,{Process Start Time},{Process Estimated Time}))ELSE(DATEDIFF(SQL_TSI_DAY,{Process Start Time},NOW())) -
ESTIMATED_COMPLETE_TIME_HOURS—IF({Process Estimated Time}!=NULL)THEN(DATEDIFF(SQL_TSI_HOUR,{Process Start Time},{Process Estimated Time}))ELSE(DATEDIFF(SQL_TSI_HOUR,{Process Start Time},NOW())) -
DAYS_SINCE_PROCESS—IF({Process Instance Status}=="ACTIVE")THEN(DATEDIFF(SQL_TSI_DAY,{Process Start Time},NOW()))ELSE(DATEDIFF(SQL_TSI_DAY,{Process End Time},NOW())) -
DAYS_SINCE_PROCESS_START—DATEDIFF(SQL_TSI_DAY,{Process Start Time},NOW()) -
PROCESS_INSTANCE_STATUS_CODE—if({Process Instance Status}=="ACTIVE")then(1)else(if({Process Instance Status}=="COMPLETED")then(2)else(3)) -
DATA_AVAILABILITY_DATE—if(true)then({Process Start Time})else({Process Start Time})
-
12.5.2 Activity Data Object
The Activity data object has the following characteristics:
-
Type — Logical Data Object
-
Full name — /oracle/processanalytics/Activity
-
Referenced data objects:
-
/oracle/processanalytics/internal/physical/Activity (physical)
-
/oracle/processanalytics/internal/physical/Activity Definition (physical)
-
/oracle/processanalytics/internal/physical/Process Definition
-
/oracle/processanalytics/internal/physical/Composite Definition
-
/oracle/processanalytics/internal/physical/Role Definition (physical)
-
-
Hierarchies:
-
ProcessActivityHierarchy — Process Display Name, Activity Display Name
-
-
Calculated fields:
-
ACTIVITY_CYCLE_TIME_IN_HOURS—Activity Running Time (millisecs)/3600000 -
ACTIVITY_CYCLE_TIME_IN_DAYS—Activity Running Time (millisecs)/86400000 -
ACTIVITY_OPEN_TIME_IN_HOURS—DATEDIFF(SQL_TSI_SECOND,Activity Start Time,NOW())/3600 -
ACTIVITY_OPEN_TIME_IN_DAYS—DATEDIFF(SQL_TSI_SECOND,Activity Start Time,NOW())/3600
-
12.5.3 HWF Task Data Object
The HWF Task data object has the following characteristics:
-
Type — Logical Data Object
-
Full name — /oracle/processanalytics/HWF Task
-
Referenced data objects:
-
/oracle/processanalytics/internal/physical/HWF Task (physical)
-
/oracle/processanalytics/internal/physical/HWF Task Definition
-
/oracle/processanalytics/internal/physical/Process Definition
-
/oracle/processanalytics/internal/physical/Composite Definition
-
/oracle/processanalytics/internal/physical/Activity Definition (physical)
-
-
Calculated fields:
-
IS_OPENED_TODAY—if((DAYOFYEAR(START_DATE)==DAYOFYEAR(NOW()))&&(YEAR(START_DATE)==YEAR(NOW())))then(1)else(0) -
IS_CLOSED_TODAY—if((DAYOFYEAR(END_DATE)==DAYOFYEAR(NOW()))&&(YEAR(END_DATE)==YEAR(NOW())))then(1)else(0) -
IS_OPEN—If(TASK_STATE=="ASSIGNED")then(1)else(0) -
IS_OPEN_AND_NOT_DUE_SOON—if((TASK_STATE=="ASSIGNED")&&(DATEDIFF(SQL_TSI_DAY,NOW(),DUE_DATE))>5)then(1)else(0) -
IS_DUE_SOON—if((TASK_STATE=="ASSIGNED")&&(DUE_DATE>NOW())&&(DATEDIFF(SQL_TSI_DAY,NOW(),DUE_DATE))<=5)then(1)else(0) -
IS_OVERDUE—if((TASK_STATE=="ASSIGNED")&&(DUE_DATE<NOW()))then(1)else(0) -
DAYS_SINCE_TASK—IF(TASK_STATE=="ASSIGNED")THEN(DATEDIFF(SQL_TSI_DAY,START_DATE,NOW()))ELSE(DATEDIFF(SQL_TSI_DAY,END_DATE,NOW())) -
DAYS_SINCE_TASK_START—DATEDIFF(SQL_TSI_DAY,START_DATE,NOW()) -
TASK_TOTAL_TIME_IN_DAYS—TASK_TOTAL_TIME/86400
-
12.5.4 HWF Task Assignment Data Object
The HWF Task Assignment data object has the following characteristics:
-
Type — Logical Data Object
-
Full name — /oracle/processanalytics/HWF Task Assignment
-
Referenced data objects:
-
/oracle/processanalytics/internal/physical/HWF Assignment (physical)
-
/oracle/processanalytics/internal/physical/HWF Task (physical)
-
/oracle/processanalytics/internal/physical/HWF Task Definition
-
/oracle/processanalytics/internal/physical/Process Definition
-
/oracle/processanalytics/internal/physical/Composite Definition
-
/oracle/processanalytics/internal/physical/Activity Definition (physical)
-
-
Hierarchies:
-
TaskAssignee — Title, Assignee Display Name
-
-
Calculated fields:
-
IS_OPEN_AND_NOT_DUE_SOON—if((TASK_STATE=="ASSIGNED")&&(DATEDIFF(SQL_TSI_DAY,NOW(),DUE_DATE))>5)then(1)else(0) -
IS_DUE_SOON—if((TASK_STATE=="ASSIGNED")&&(DUE_DATE>NOW())&&(DATEDIFF(SQL_TSI_DAY,NOW(),DUE_DATE))<=5)then(1)else(0) -
IS_OVERDUE—if((TASK_STATE=="ASSIGNED")&&(DUE_DATE<NOW()))then(1)else(0) -
DAYS_SINCE_ASSIGNMENT—IF(TASK_STATE=="ASSIGNED")THEN(DATEDIFF(SQL_TSI_DAY,ASSIGNMENT_START_DATE,NOW()))ELSE(DATEDIFF(SQL_TSI_DAY,ASSIGNMENT_END_DATE,NOW())) -
TOTAL_TIME_IN_DAYS—TOTAL_TIME/86400
-
