17 Multiserver Domains
How you can use Oracle Stream Analytics Visualizer to manage aspects of a multiserver domain (or cluster), including viewing native and Coherence cluster membership and topology diagrams, as well as cache information is described.
This chapter includes the following sections:
17.1 View Cluster Group Membership
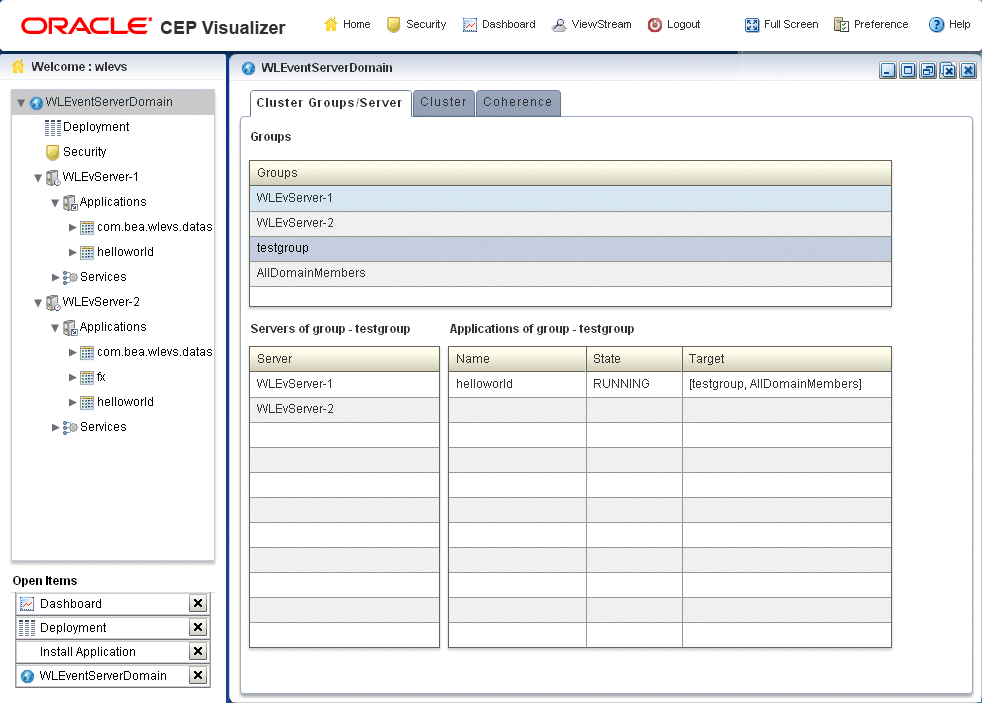
You can view the default and user-defined cluster groups, what servers belong to those groups, and what applications are deployed to those groups.
By default, there is a group for
each server with the same name as the server and a group named AllDomainMembers which represents all the servers in the
domain. In addition, you can define custom groups when you configure
your cluster.
You may deploy an application to a cluster group or to an individual server. When you deploy to a cluster group, the application belongs to the group, not the individual servers in the group. When you deploy to an individual server, the application belongs to the server's own group.
For more information, see Deploy an Application in a Multiserver Domain.
View Cluster Group Membership
17.2 View all Cluster Topologies
Using Oracle Stream Analytics Visualizer, you can view all cluster topologies regardless of cluster implementation. You can also view cluster group properties and server instance properties.
If you deploy an Oracle Stream Analytics high availability application, you can view the Oracle Stream Analytics high availability topology. For more information, see View High Availability Cluster Topologies.
If you are using Oracle Coherence for clustering, you can view Oracle Coherence topology. For more information, see View Oracle Coherence Cluster Topologies.
View All Cluster Topologies
17.3 View High Availability Cluster Topologies
Using Oracle Stream Analytics Visualizer, you can view an Oracle high availability cluster topology. You can also view cluster group properties and server instance properties.
View High Availability Cluster Topologies
-
In the left pane, click the Domain node, where Domain refers to the name of your Oracle Stream Analytics domain.
-
In the right pane, click the Cluster tab.
-
In the right pane, click the Topology tab.
For an Oracle Stream Analytics high availability application, you can use the Topology tab to:
-
Visualize a high-availability configuration.
-
Visualizer a high-availability and scalability configuration.
See Visualize a High Availability and Scalability Configuration.
For information on the various tools along the top of the topology canvas, see Manage the Cluster Topology Diagram.
-
-
To view the properties for a given group, click on the group in the Group List.
-
To view the properties for a given server instance, click on the server instance in the Group List.
-
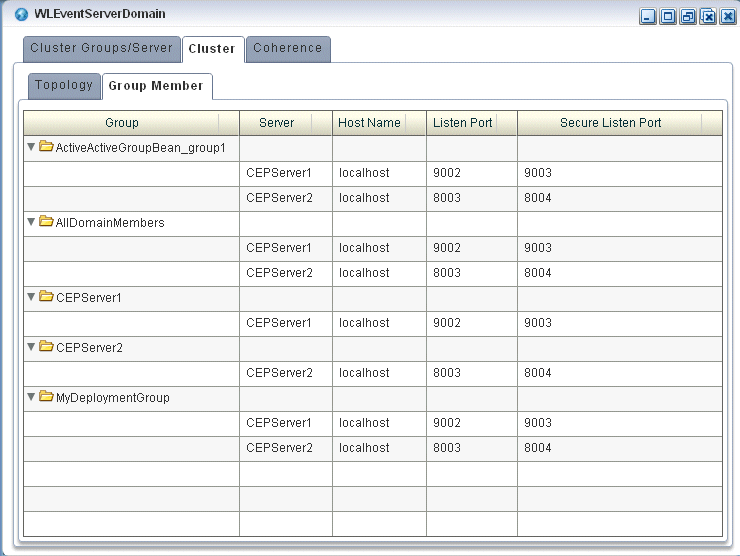
To view details on a given server instance, click the Group Member tab and select the group and server instance as Figure 17-5 shows.
-
Use the Group Member tab to customize the group table:
-
To change the order of columns, click on the column name in the cache chart and drag left or right.
-
To change the sort order of a column, click the triangle to the right of the column name in the cache chart.
-
17.3.1 Visualize a High Availability Configuration
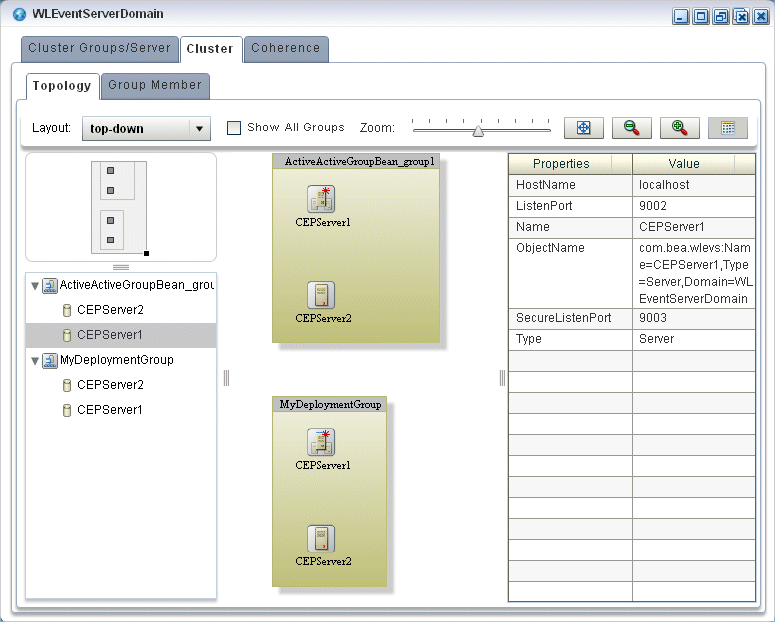
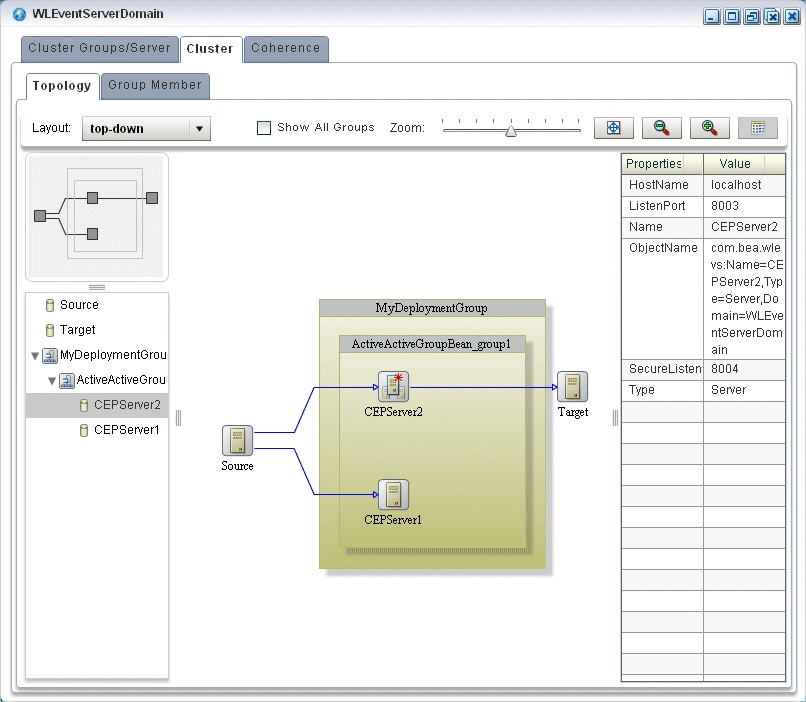
For an Oracle Stream Analytics high availability application, the Topology tab shows the notification group nested within the deployment group.
In Figure 17-6, the deployment group is MyDeploymentGroup and the notification group is ActiveActiveGroupBean_group1.
Figure 17-6 Cluster Topology Tab: Oracle Stream Analytics High Availability
Description of "Figure 17-6 Cluster Topology Tab: Oracle Stream Analytics High Availability"
The primary server is identified by the icon that Figure 17-7 shows. In Figure 17-6, the primary server is CEPServer2.
Figure 17-7 Primary Server
The stream data source inputs to both primary and secondary servers but only the primary server outputs events. If CEPServer2 goes down, an Oracle high availability failover occurs and CEPServer1 resumes outputting events as the new primary for ActiveActiveGroupBean_group1. When CEPServer2 is brought back online, it rejoins ActiveActiveGroupBean_group1 as a secondary server.
For information on the various tools along the top of the topology canvas, see Manage the Cluster Topology Diagram.
17.3.2 Visualize a High Availability and Scalability Configuration
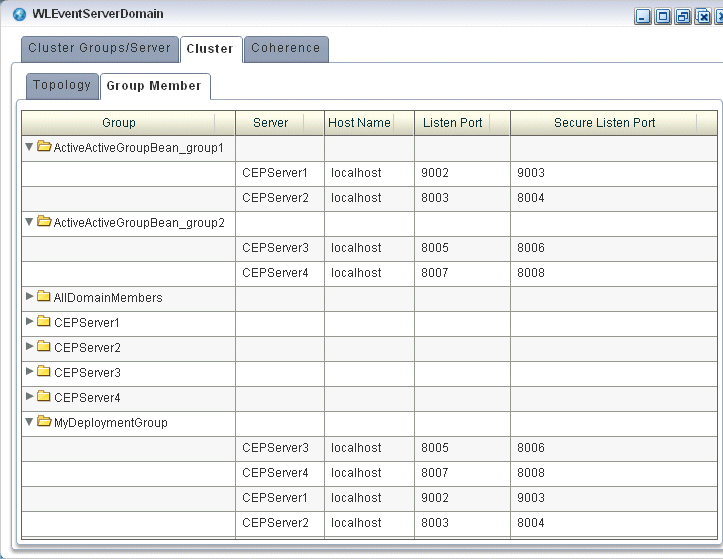
If your Oracle Stream Analytics high availability application combines high availability and scalability, then the Topology tab shows notification groups nested within the deployment group.
In Figure 17-8, the deployment group is MyDeploymentGroup and the notification groups are ActiveActiveGroupBean_group1 and ActiveActiveGroupBean_group2.
Figure 17-8 Cluster Topology Tab: Oracle Stream Analytics High Availability and Scalability
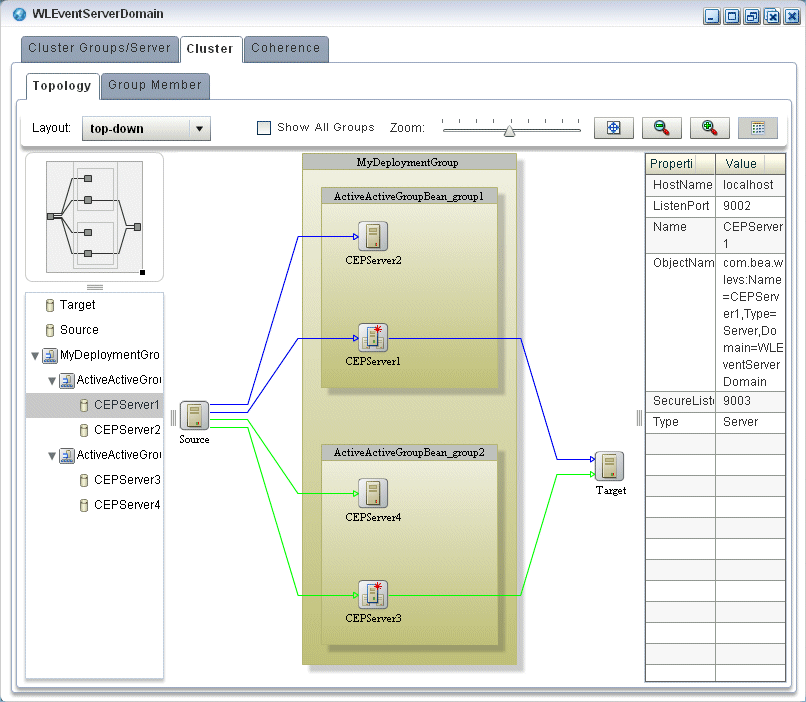
Description of "Figure 17-8 Cluster Topology Tab: Oracle Stream Analytics High Availability and Scalability"
The primary server is identified by the icon that Figure 17-9 shows. In Figure 17-8, the primary server of notification group ActiveActiveGroupBean_group1 is CEPServer1 and the primary server of notification group ActiveActiveGroupBean_group2 is CEPServer3.
Figure 17-9 Primary Server
The stream data source inputs to both primary and secondary servers in each notification group but only the primary server in each notification group outputs events. The stream data source is partitioned (by JMS selector) so that each notification group processes a different subset of the input data. The Oracle Stream Analytics Visualizer indicates this with a different colored line for each notification group. For example, ActiveActiveGroupBean_group1 may process events with accountID <= 500 and ActiveActiveGroupBean_group2 may process events with accountID > 500. Both CEPServer1 and CEPServer2 process events with accountID <= 500 in parallel and CEPServer3 and CEPServer4 process events with accountID > 500 in parallel. If CEPServer1 goes down, an Oracle high availability failover occurs and CEPServer2 resumes outputting events as the new primary for ActiveActiveGroupBean_group1. When CEPServer1 is brought back online, it rejoins ActiveActiveGroupBean_group1 as a secondary server.
For information on the various tools along the top of the topology canvas, see Manage the Cluster Topology Diagram.
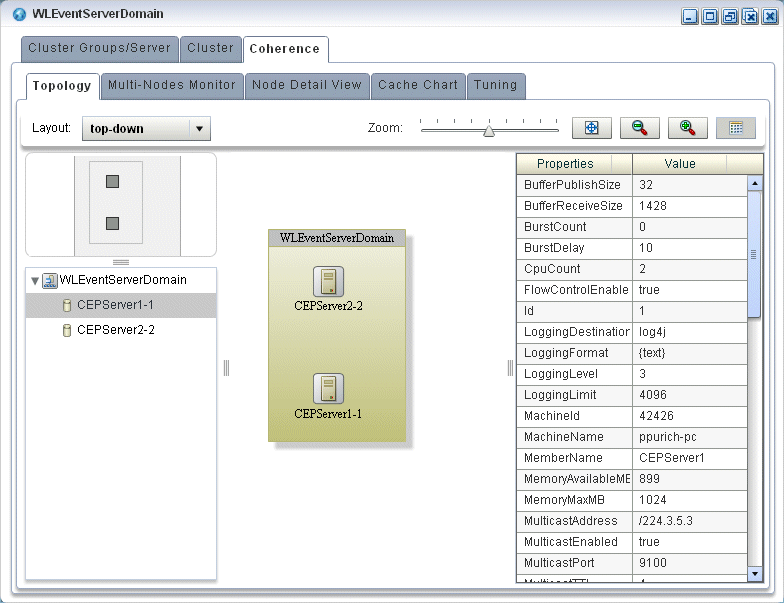
17.4 View Oracle Coherence Cluster Topologies
Using Oracle Stream Analytics Visualizer, if you are using Oracle Coherence clustering, you can view Oracle Coherence cluster topologies, cluster group properties, and server instance properties.
To view all clustering topologies regardless of clustering implementation, see View all Cluster Topologies.
View Oracle Coherence Cluster Topologies
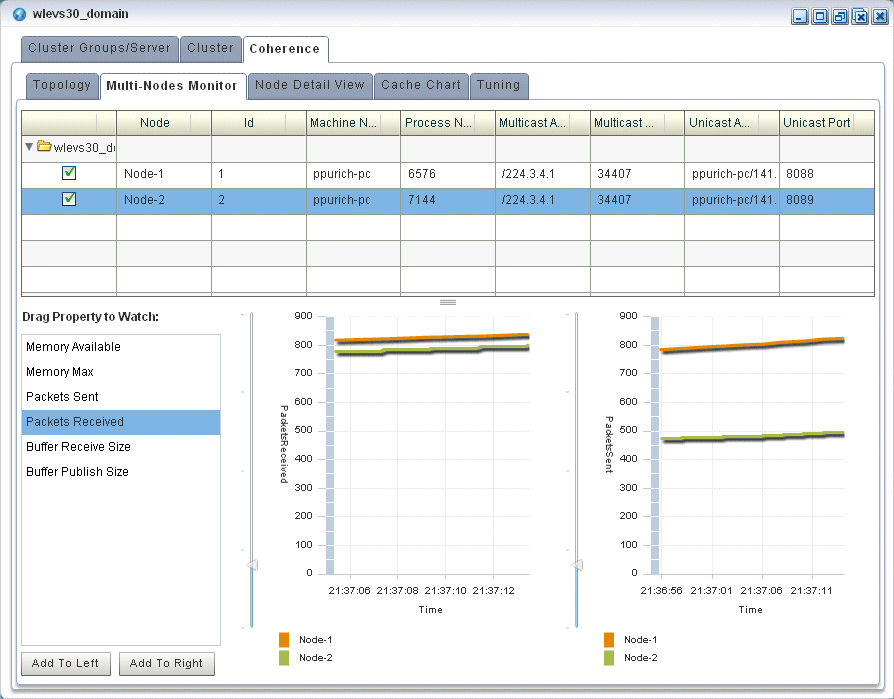
17.5 Monitor Nodes in an Oracle Coherence Cluster
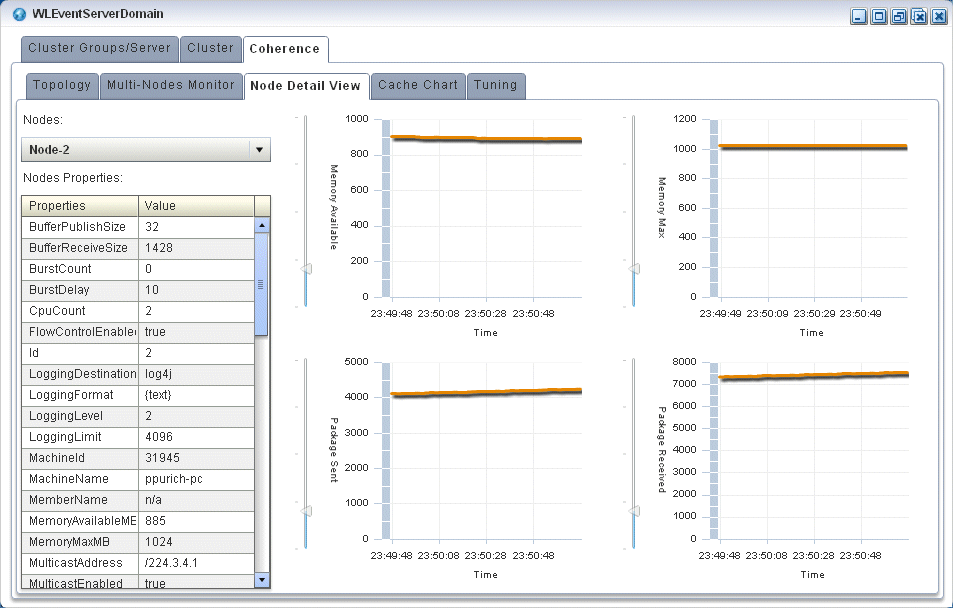
Using Oracle Stream Analytics Visualizer, you can compare a combination of properties for any and all nodes in an Oracle Coherence cluster. For a selected node in an Oracle Coherence cluster, you can view a select list of properties.
Once you have determined the root cause of a problem, you can tune Oracle Coherence parameters to correct the problem. For more information, see Tune Oracle Coherence.
Monitor Nodes in an Oracle Coherence Cluster
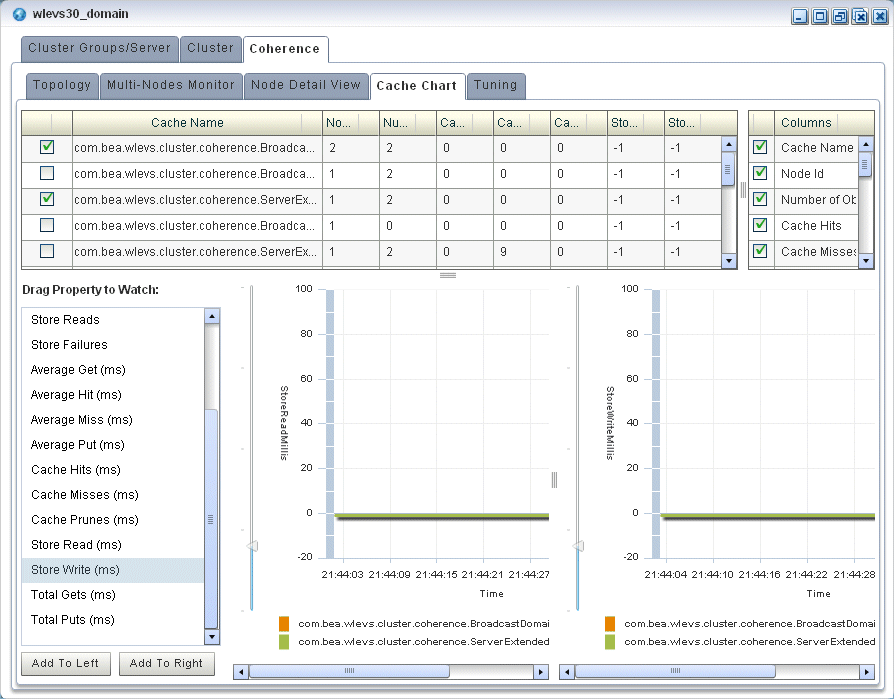
17.6 Monitor an Oracle Coherence Cache
Using Oracle Stream Analytics Visualizer, you can monitor a wide variety of Oracle Coherence cache parameters and graphically compare parameter values to locate and diagnose performance and operational problems.
Once you have determined the root cause of a problem, you can tune Oracle Coherence parameters to correct the problem. For more information, see Tune Oracle Coherence.
Monitor an Oracle Coherence Cache
17.7 Tune Oracle Coherence
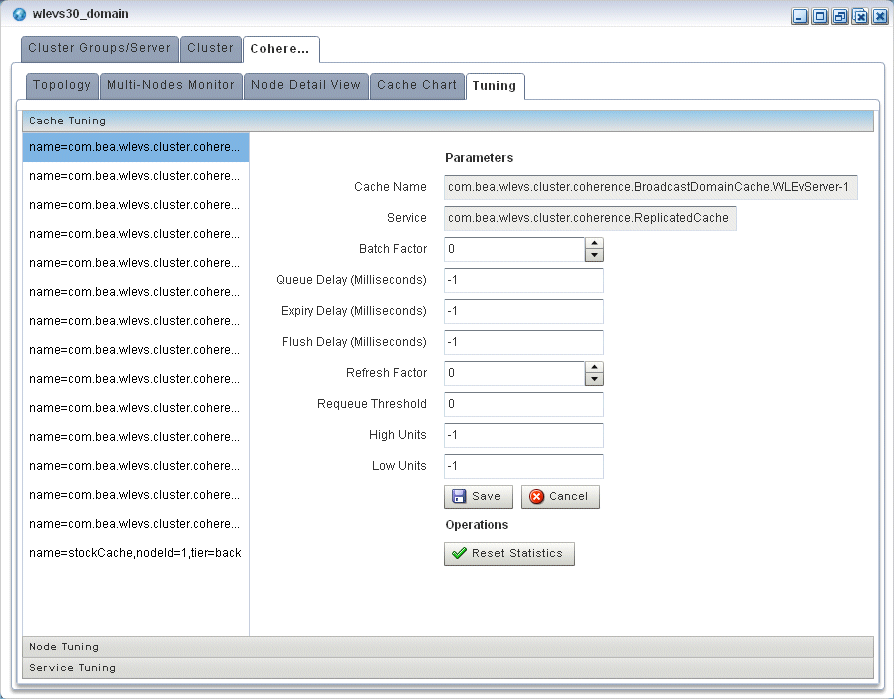
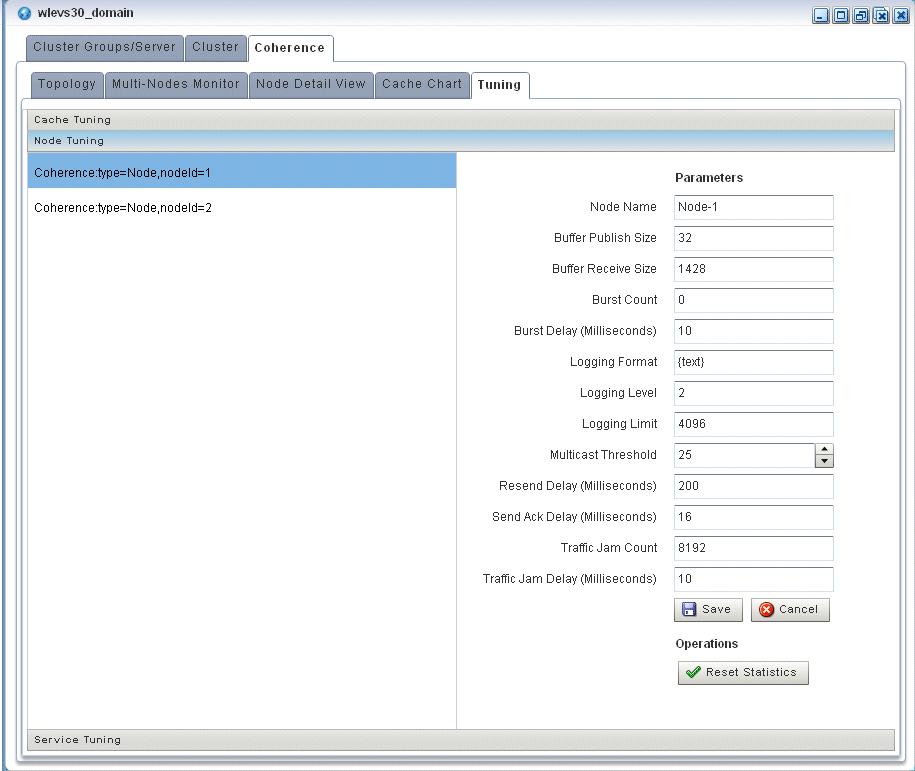
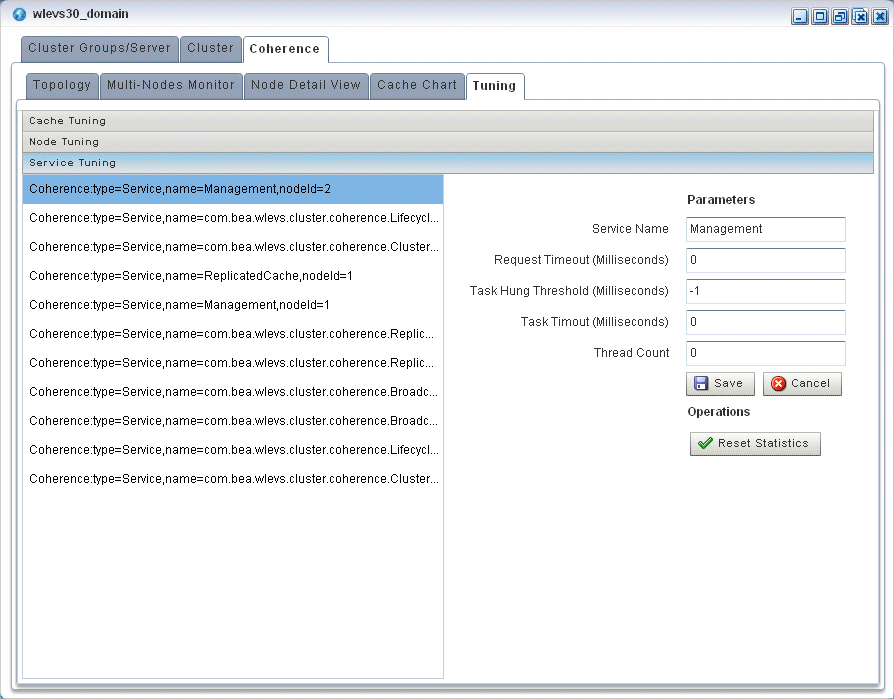
Using Oracle Stream Analytics Visualizer, you can view and modify a variety of Oracle Coherence parameters to fine tune Oracle Coherence performance.
Note:
Not all Oracle Coherence parameters can be modified. For more information, refer to your Oracle Coherence documentation.
To determine the root cause of a problem, you can monitor Oracle Coherence parameters. For more information, see:
Tune Oracle Coherence:-
17.8 Manage the Cluster Topology Diagram
You use the topology tools to manage the topology diagram of your cluster topology.
This section describes the various tools along the top of the Topology canvas as Figure 17-17 shows.
17.8.1 Choose Layout
Use the Choose Layout pull-down menu to select alternate ways of distributing cluster groups. You can choose any of:
-
top-down
-
organic
-
hierarchic
-
orthogonal
17.8.2 Show All Groups
Check the Show All Groups option to show all the cluster topology groups listed on the Cluster Groups/Server tab including the AllDomainMembers group and the per-server groups.
This option is unchecked by default to reduce clutter on the Cluster Topology tab and to allow you to focus on the most important groups.
17.8.3 Zoom
Use the Zoom slider to increase or decrease the zoom level. This is an alternative to using the Zoom In and Zoom Out buttons (see Zoom In and Zoom Out).
17.8.4 Fit Content
Click the Fit Content button to adjust the zoom level automatically to make all of the diagram visible in the current browser window.
17.8.5 Zoom In and Zoom Out
Click the Zoom In and Zoom Out buttons to change the zoom level. This is an alternative to using the Zoom slider (see Zoom).
