11 JMX
Oracle Stream Analytics provides standards-based interfaces that are fully compliant with the Java Management Extensions (JMX) specification. Software developers can use these interfaces to monitor Oracle Stream Analytics management beans (MBeans), to change the configuration of an Oracle Stream Analytics domain, and to monitor Oracle Stream Analytics applications.
This chapter includes the following sections:
11.1 MBean Usage
Software developers implement MBean interfaces to design and develop an Oracle Stream Analytics management console to be used by the administrators at a customer installation. EPN configuration tasks include adding and removing Oracle CQL or rules, changing the channel maximum size, subscribing to notifications, and executing operations.
Currently there is no MBean support for deploying and undeploying application libraries on a local or remote server. See Deployer Command-Line Reference for more information.
You can manipulate MBeans with any of the following tools:
-
Oracle Stream Analytics Visualizer.
-
wlevs.Admincommand-line utility. See About the wlevs.Admin Command-Line Reference. -
Deployer command-line deployment utility. See Deployer Command-Line Reference.
-
jconsole, which is the JMX console provided by the JDK. -
In Java code with standard JMX APIs. See http://www.oracle.com/technetwork/java/javase/tech/index-jsp-142926.html.
11.2 Access the Oracle Stream Analytics JMX Server
To access Oracle Stream Analytics MBeans, you must first connect to the Oracle Stream Analytics JMX server.
Oracle Stream Analytics does not support the JRMP protocol. Instead, JMX clients must use the more secure MSA protocol for both local and remote access to the Oracle Stream Analytics JMX server.
When you connect to the Oracle Stream Analytics JMX server that is running on localhost or on a remote host, you must copy the following Oracle Stream Analytics server JAR files to the client class
path of the host from which you want to connect to the Oracle Stream Analytics server:
-
Oracle\Middleware\my_oep\oep\wlserver\modules\com.bea.core.jmx_13.0.0.0.jar -
Oracle\Middleware\my_oep\oep\wlserver\modules\com.bea.core.rmi_13.0.0.0.jar -
Oracle\Middleware\my_oep\oep\wlserver\modules\com.bea.core.jndi.context_13.0.0.0.jar -
Oracle\Middleware\my_oep\oep\wlserver\modules\com.bea.core.logging_3.0.0.0.jar -
Oracle\Middleware\my_oep\oep\wlserver\modules\com.bea.core.bootbundle_13.0.0.0.jar
You must launch your JMX client (such as jconsole) using the following command line options and classpath
(split for readability.
java -Djmx.remote.protocol.provider.pkgs=com.bea.core.jmx.remote.provider -Dmx4j.remote.resolver.pkgs=com.bea.core.jmx.remote.resolver -Djava.naming.factory.initial=com.bea.core.jndi.context.ContextFactory -classpath %JAVA_HOME%\lib\jconsole.jar;MODULE_HOME\modules\com.bea.core.jmx_13.0.0.0.jar;MODULE_HOME\modules\com.bea.core.rmi_7.0.0.0.jar;MODULE_HOME\modules\com.bea.core.jndi.context_7.0.0.0.jar;MODULE_HOME\modules\com.bea.core.logging_1.5.0.0.jar;MODULE_HOME\modules\com.bea.core.bootbundle_8.0.0.0.jar sun.tools.jconsole.JConsole
Where MODULE_HOME is
the directory you copied the Oracle Stream Analytics server JAR files to.
To connect to the Oracle Stream Analytics JMX server, you must use
the JMX URL service:jmx:msarmi://HOST-NAME:port/jndi/jmxconnector so that you are always using the MSA connector (where HOST-NAME is either localhost or the
name of the remote host and port is the Oracle Stream Analytics server JNDI port).
For more information, see:
11.3 Types of MBeans
Oracle Stream Analytics exposes configuration and run time MBeans.
Configuration MBeans contain configuration information
about EPN components, a deployed applications, servers, and domains.
These MBeans have a fixed management interface and represent the information
contained in the server config.xml file and the component configuration
file. CQLProcessorMBean and EventChannelMBean are examples of configuration MBeans.
Every component in a deployed application (adapter, channel, or processor) has a configuration MBean that manages the underlying configuration of the component. Each type of component has its own set of manageable artifacts. For example, you can dynamically configure the maximum number of threads for a channel or the Oracle CQL rules associated with a processor.
Run time MBeans contain monitoring information for each component in the EPN with run time MBeans. Monitoring information includes throughput (number of events passing through a component) and latency (how long it takes an event to pass through a component).
See Oracle Fusion Middleware Using Visualizer for Oracle Stream Analytics for information about specific MBeans.
11.3.1 Configuration MBeans
When you deploy an Oracle Stream Analytics application, the server creates a configuration MBean for each component in the EPN whose manageability has been enabled or for each component registered in the EPN assembly file. If you have extended the configuration of an adapter, then the server deploys a custom configuration MBean for the adapter.
Using JMX, you can dynamically configure the component using its configuration MBean. For example, using the EventChannelMBean.setMaxSize() method you can set the size of a channel component.
11.3.2 Configuration MBean Naming
Oracle Stream Analytics configuration MBeans are arranged in a hierarchy. The object name of each MBean reflects its position in the hierarchy.
A typical object naming pattern is as follows:
com.bea.wlevs:Name=name,Type=type,[TypeOfParentMBean=NameOfParentMBean]
where:
-
com.bea.wlevs:is the JMX domain name. -
Name=name,Type=type,[TypeOfParentMBean=NameOfParentMBean]is a set of JMX key properties.
The order of the key properties is not significant, but the object name must begin with com.bea:wlevs:.
For example, the object name of the MBean corresponding to a processor called myprocessor in the application myapplication in the domain is as follows:
com.bea.wlevs:Name=myprocessor,Type=CQLProcessor,Application=myapplication
Table 11-1 describes the key properties that Oracle Stream Analytics encodes in its MBean object names.
Table 11-1 Oracle Stream Analytics MBean Object Name Key Properties
| This Key Property | Specifies |
|---|---|
Name=name |
The string that you provided when you created the resource that the MBean represents. This is typically the name of a component. The name of a particular component is specified in the EPN assembly file using the For example, in the case of processors, the entry in the EPN assembly file might look like the following: <wlevs:processor id="myprocessor" advertise="true" /> In this case, the key property would be |
Type=type |
The short name of the MBean's type. The short name is the unqualified type name without the For example, for an MBean that is an instance of the |
TypeOfParentMBean=NameOfParentMBean |
Specifies the type and name of the parent MBean. For components, this is always The name of a particular Oracle Stream Analytics application is specified with the Manifest-Version: 1.0 Archiver-Version: Build-Jdk: 1.5.0_06 .... Bundle-SymbolicName: myapplication then the key property would be |
Table 11-2 shows examples of configuration MBean object names that correspond to the component declarations in the HelloWorld sample EPN assembly file. In each example, the application name is helloworld and the domain name is myDomain.
Table 11-2 Component Declaration Example With Corresponding MBean Object Names
| EPN Assembly File Component Declaration | Corresponding Configuration MBean Object Name |
|---|---|
<wlevs:processor id="helloworldProcessor" /> |
com.bea.wlevs:Name=helloworldProcessor,Type=CQLProcessor,Application=helloworld,Domain=myDomain
|
<wlevs:channel id="helloworldInstream"> <wlevs:listener ref="helloworldProcessor"/> <wlevs:source ref="helloworldAdapter"/> </wlevs:channel> |
com.bea.wlevs:Name=helloworldInstream,Type=EventChannel,Application=helloworld,Domain=myDomain
|
11.3.3 Run Time MBeans
You can gather monitoring information for each component in the EPN with run time MBeans. Oracle Stream Analytics server defines the following metrics that you can monitor for each component:
-
Throughput: The number of events processed by the component. The parameters for this metric are: throughput time interval, aggregation time interval, the unit of time for the intervals.
-
Average Latency: The average amount of time it takes an event to pass through a component, or latency. Parameters: aggregation time interval, the unit of time for the interval.
-
Maximum Latency: The maximum amount of time it takes an event to pass through a component. Parameters: aggregation time interval, the unit of time for the interval.
-
Average Latency Threshold: Specifies whether the average latency of events between the start- and end-points of a component crosses a specified threshold. Parameters: aggregation time interval, threshold, the unit of time for the interval.
11.3.4 Run Time MBean Naming
Run time MBeans are named using the same pattern as configuration mbeans except for one extra property: Direction. This property has two valid values: OUTBOUND or INBOUND that refer to the point at which you want to gather the statistic OUTBOUND means that you want to gather throughput or latency as events flow out of the specified component; similarly INBOUND means you want to gather the monitoring information as events flow into a component.
For example, the object name of the run time MBean corresponding to a processor called myprocessor in the application myapplication, in which events will be monitored as they flow into the component, is as follows:
com.bea.wlevs:Name=myprocessor,Type=CQLProcessor,Application=myapplication,Direction=INBOUND
See Configuration MBean Naming for details about configuration MBean naming.
11.3.5 Event Processing MBean Hierarchy
All MBeans must be registered in an MBean server under an object name of type javax.management.ObjectName. Oracle Stream Analytics follows a convention in which object names for child MBeans contain part of its parent MBean object name.
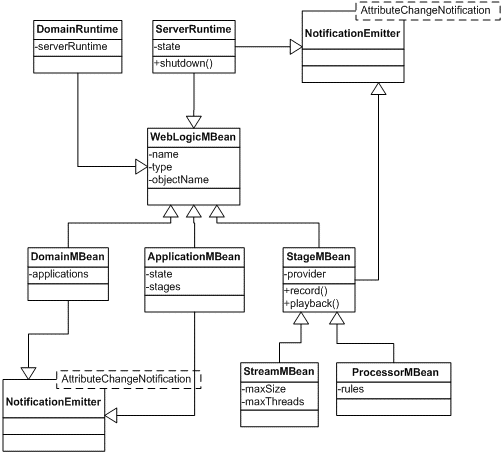
There are two main MBean roots: DomainMBean and DomainRuntimeMBean. The former includes configuration MBeans for the entire domain, the latter contains run time information, such as statistics, and local services, such as Monitor, that are generally kept to a single server instance.
ApplicationMBean is a child of the DomainMBean instead of the ServerMBean. This is because an application is unique within a domain, and can span multiple servers.
Figure 11-1 shows the main classes and relationships that make up the object model.
Figure 11-1 Event Processing MBean Object Model

Description of "Figure 11-1 Event Processing MBean Object Model"
Most MBeans emit notifications and generate AttributeChangeNotifications. A JMX client can register to receive attribute change notifications regarding changes to application state, insertion and removal of applications at the domain, channel size and thread changes, insertion and removal of rules, and so on.
11.4 Configure JMX
Before you can manage Oracle Stream Analytics applications, servers, and domains using JMX and Oracle Stream Analytics MBeans, you must first configure the JMX service on your Oracle Stream Analytics server.
11.4.1 Example JMX Configuration
The following snippet from a config.xml files shows a JMX configuration.
<config>
  <netio>
    <name>JettyNetio</name>
    <port>12345</port>
  </netio>
  <work-manager>
    <name>WM</name>
    <fairshare>5</fairshare>
    <min-threads-constraint>1</min-threads-constraint>
    <max-threads-constraint>4</max-threads-constraint>
  </work-manager>
  <jetty>
    <name>TestJetty</name>
    <work-manager-name>WM</work-manager-name>
    <network-io-name>JettyNetio</network-io-name>
  </jetty>
  <rmi>
    <name>RMI</name>
    <http-service-name>TestJetty</http-service-name>
  </rmi>
  <jndi-context>
    <name>JNDI</name>
  </jndi-context>
  <exported-jndi-context>
    <name>exportedJNDI</name>
    <rmi-service-name>RMI</rmi-service-name>
  </exported-jndi-context>
  <jmx>
    <jndi-service-name>JNDI</jndi-service-name>
    <rmi-service-name>RMI</rmi-service-name>
  </jmx>
</config>
11.4.2 JMX Configuration Objects
You configure the Oracle Stream Analytics JMX service with the following elements in the config.xml file that describes your Oracle Stream Analytics server:
For information on security configuration tasks that affect JMX, see Configure JMX Security.
jmx
Table 11-3 lists the jmx element child elements in the config.xml file that you must configure.
Table 11-3 Configuration Parameters for the jmx Element
| Parameter | Type | Description |
|---|---|---|
rmi-service-name |
String |
The name of the RMI service with which the jmx server will register to receive calls. |
jndi-service-name |
String |
The name of the JNDI service to which the jmx server will bind its object. |
rmi
The Oracle Stream Analytics RMI service provides the following:
-
Ability to register a POJO interface in a server for remote method invocation from a client.
-
Ability to register for any context propagation from the client to the server on a remote method invocation, intercept, and act on this propagated context in the server.
Table 11-4 lists the rmi element child elements in the config.xml file that you use to export server-side objects to remote clients.
Table 11-4 Configuration Parameters for the rmi Element
| Parameter | Type | Description |
|---|---|---|
heartbeat-period |
int |
The number of failed heartbeat attempts before triggering disconnect notifications to all registered listeners. |
http-service-name |
String |
The name of the HTTP service used to register remote objects (such as Jetty, see Jetty.). |
heartbeat-interval |
int |
The amount of time, in milliseconds, between heartbeats. Once the number of unsuccessful heartbeat attempts has reached the value specified by the |
name |
String |
The name of this configuration object. |
jndi-context
The JNDI Factory Manager is responsible for supporting JNDI in an OSGi environment. It allows JNDI providers to be supplied as OSGi bundles, and for code running inside OSGi bundles to have full access to the JNDI environment.
The Factory Manager consists of two components:
-
An OSGi bundle, which provides the OSGi-specific factory management code, to look up JNDI objects using the appropriate OSGi classloader.
-
JNDI glue code, internal to Oracle Stream Analytics, that initializes the JNDI environment to support the factory manager bundle.
Table 11-5 lists the jndi-context element child elements in the config.xml file that you must configure.
Table 11-5 Configuration Parameters for the jndi-context Element
| Parameter | Type | Description |
|---|---|---|
default-provider |
boolean |
If Default value is |
name |
String |
The name of this configuration object. |
exported-jndi-context
Requires a configured jndi-context.
Use this configuration object to export a remote JNDI service to a client using RMI. A JNDI context is registered with the RMI service to provide remote access to clients that pass a provider URL parameter in their InitialContext object.
Table 11-6 lists the exported-jndi-context element child elements in the config.xml file that you must configure.
Table 11-6 Configuration Parameters for the exported-jndi-context Element
| Parameter | Type | Description |
|---|---|---|
rmi-service-name |
String |
The name of the RMI service that should be used to serve this JNDI context over the network. It must match an existing |
name |
String |
The name of this configuration object. The value of this element must be different from the value of the |
11.5 Manage with JMX
This section describes detailed examples of managing Oracle Stream Analytics components using JMX.
Examples include:
-
Connect with APIs to a JMX Server from a Non-Oracle Stream Analytics Client
-
Connect with APIs to a JMX Server From an Oracle Stream Analytics Client
-
Configure an Oracle Stream Analytics Component with JMX APIs
-
Monitor the Throughput and Latency of a Component with JMX APIs
-
Connect to a Local or Remote JMX Server using JConsole with Security
-
Connect to Local or Remote JMX Server Using JConsole with Security Disabled.
Note:
When using JConsole, you must start it with the Oracle Stream Analytics wlevsjconsole.cmd or wlevsjconsole.sh script. You cannot start jconsole directly.
11.5.1 Connect with APIs to a JMX Server from a Non-Oracle Stream Analytics Client
This section describes how to write Java code using the JMX API (http://java.sun.com/javase/technologies/core/mntr-mgmt/javamanagement) to connect to the Oracle Stream Analytics JMX server from a non-Oracle Stream Analytics client. This is the first step to all programmatic JMX management.
For information on connecting to the Oracle Stream Analytics JMX server from another Oracle Stream Analytics server, see Connect with APIs to a JMX Server From an Oracle Stream Analytics Client.
Use APIs to connect to a JMX server from a non-Oracle Stream Analytics client:
11.5.2 Connect with APIs to a JMX Server From an Oracle Stream Analytics Client
This section describes how to write Java code using the JMX API (http://java.sun.com/javase/technologies/core/mntr-mgmt/javamanagement) to connect to the Oracle Stream Analytics JMX server from another Oracle Stream Analytics server. This is the first step to all programmatic JMX management.
For information on connecting to the Oracle Stream Analytics JMX server from a non-Oracle Stream Analytics client, see Connect with APIs to a JMX Server from a Non-Oracle Stream Analytics Client.
Use APIs to connect to the JMX server from an Oracle Stream Analytics client:
11.5.3 Configure an Oracle Stream Analytics Component with JMX APIs
This section describes how to write Java code using the JMX API (http://java.sun.com/javase/technologies/core/mntr-mgmt/javamanagement) to access Oracle Stream Analytics MBeans.
Configure an Oracle Stream Analytics component with JMX APIs:
11.5.4 Monitor the Throughput and Latency of a Component with JMX APIs
This section describes how to write Java code using the JMX API (http://java.sun.com/javase/technologies/core/mntr-mgmt/javamanagement) to access Oracle Stream Analytics MBeans and dynamically monitor the throughput and latency of an Oracle Stream Analytics component.
Dynamically configure an Oracle Stream Analytics component with JMX APIs:
-
Acquire a connection to the Oracle Stream Analytics JMX server.
For details see Connect with APIs to a JMX Server from a Non-Oracle Stream Analytics Client.
-
Acquire an instance of a
MonitorRuntimeMBeanfor the component you want to monitor as shown below.ObjectName processorInbound = ObjectName.getInstance( "com.bea.wlevs:Name=myprocessor," + "Type=CQLProcessor," + "Application=myapplication," + "Direction=INBOUND" );Be sure you specify whether you want to monitor incoming events (
INBOUND) or outgoing events (OUTBOUND). -
Use the
MonitorRuntimeMBeanto acquire an instance ofProbeRuntimeMBeanfor the type of statistic you want as shown below.ObjectName monitorName = ObjectName.getInstance( "com.bea.wlevs:ServerRuntime=localhost," + "Name=MonitorRuntime," + "Type=MonitorRuntime"); MonitorRuntimeMBean monitorMBean = (MonitorRuntimeMBean)MBeanServerInvocationHandler.newProxyInstance( connection, monitorName, MonitorRuntimeMBean.class, false); ObjectName probeName = monitorMBean.monitorAvgThroughput( processorInbound, 1000, 1000 ); ProbeRuntimeMBean probeOn = (ProveRuntimeMBean)MBeanServerInvocationHandler.newProxyInstance( connection, probeName, ProbeRuntimeMBean.class, false );The
MonitorRuntimeMBeanhas methods for each type of statistic you can gather. For example, you executemonitorAvgLatency()if you want to monitor the average latency,monitorAvgThroughput()to monitor the average throughput, and so on. These methods all returnProbeRuntimeMBean. -
Use the
ProbeRuntimeMbeaninstance to get the actual run time metrics in one of the following ways:-
Use the
ProbeRuntimeMBeanmethodgetMetric()to pull the information. -
Use
javax.management.NotificationBroadcaster.addNotificationListener()to have the information pushed to you every time there is a change in the metrics.
-
-
When you are finished gathering monitoring information, unregister the MBean from the MBean server as shown below.
probON.terminate();For additional details about these MBean interfaces and how to use them to monitor throughput and latency, see the
com.bea.wlevs.monitor.managementpackage in the Java API Reference for Oracle Stream Analytics.
11.5.5 Connect to a Local or Remote JMX Server using JConsole with Security
You can use the wlevsjconsole script to connect to an Oracle Stream Analytics JMX server running on your local host or on a remote host to browse and manage Oracle Stream Analytics MBeans with the JDK jconsole.
This procedure describes how to use JConsole when the Oracle Stream Analytics server has security enabled. This is the default configuration and is recommended for production servers. Alternatively, you can connect to the JMX server with security disabled (see Connect to Local or Remote JMX Server Using JConsole with Security Disabled).
For more information, see Access the Oracle Stream Analytics JMX Server.
Note:
When using JConsole, you must start it with the Oracle Stream Analytics wlevsjconsole.cmd or wlevsjconsole.sh script. You cannot start jconsole directly.
Connect to a local or remote JMX server using JConsole with security enabled:
-
Ensure that the local or remote Oracle Stream Analytics server is running.
-
Launch
jconsoleusing thewlevsjconsole.cmdorwlevsjconsole.shscript located in the/Oracle/Middleware/my_oep/oep/bindirectory.-
To connect to a local Oracle Stream Analytics server, enter:
prompt> wlevsjconsole.cmd
-
To connect to a remote Oracle Stream Analytics server, enter:
prompt> wlevsjconsole.cmd
HOST-NAME:PORTWhere
HOST-NAMEis the name of the remote host andPORTis the Net IO port as configured in the remote host's/Oracle/Middleware/my_oep/user_projects/domains/myDomain/defaultserver/config/config.xmlfile.
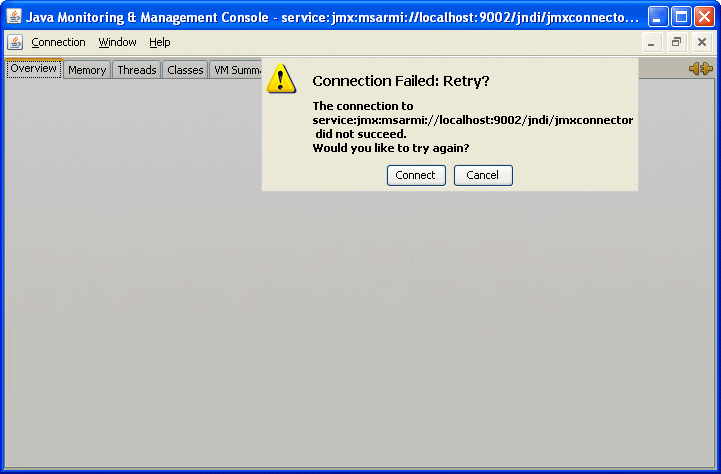
The jconsole browser attempts to log into the JMX server and initially fails as Figure 11-2 shows.
Figure 11-2 Jconsole Initial Login Attempt

Description of "Figure 11-2 Jconsole Initial Login Attempt" -
-
Click Cancel.
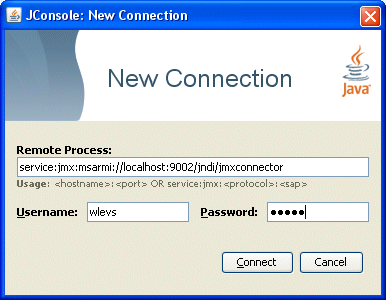
The
JconsoleNew Connection dialog appears as shown in Figure 11-3.Figure 11-3 JConsole New Connection Dialog

Description of "Figure 11-3 JConsole New Connection Dialog" -
Configure the New Connection dialog as described in the following table.
Table 11-7 JConsole New Connection Attributes
Attribute Description Remote ProcessEnter the following URL:
service:jmx:msarmi://
HOST-NAME:PORT/jndi/jmxconnectorWhere
HOST-NAMEis the name of the local or remote host andPORTis the Net IO port as configured in the remote host's/Oracle/Middleware/my_oep/user_projects/domains/myDomain/defaultserver/config/config.xmlfile (default:9002).UsernameEnter the Oracle Stream Analytics administration user name: oepadmin.
PasswordEnter the Oracle Stream Analytics administration password: welcome1.
-
Click Connect.
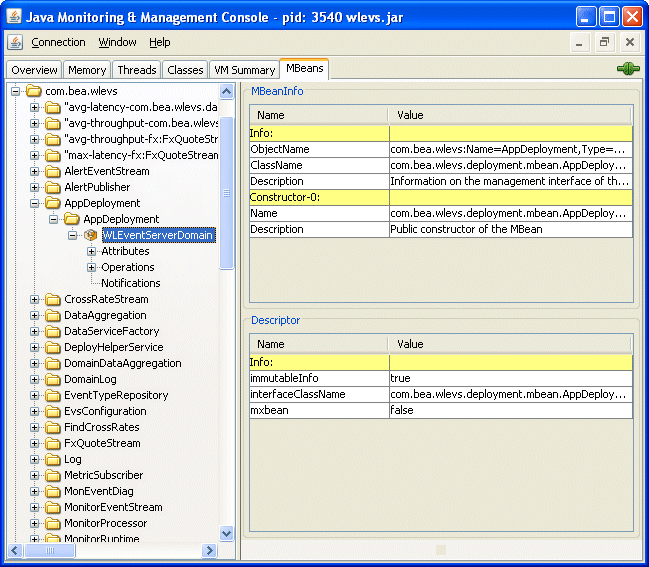
The
jconsolebrowser opens and provides access to Oracle Stream Analytics MBeans as Figure 11-4 shows.
11.5.6 Connect to Local or Remote JMX Server Using JConsole with Security Disabled
You can use the wlevsjconsole script to connect to an Oracle Stream Analytics JMX server running on your local host or on a remote host to browse and manage Oracle Stream Analytics MBeans with the JDK jconsole.
This procedure describes how to use JConsole when the Oracle Stream Analytics server has security disabled. This is a common development configuration and is not recommended for production servers. Alternatively, you can connect to the JMX server with security enabled (see Connect to a Local or Remote JMX Server using JConsole with Security).
For more information, see Access the Oracle Stream Analytics JMX Server.
Note:
When using JConsole, you must start it with the Oracle Stream Analytics wlevsjconsole.cmd or wlevsjconsole.sh script. You cannot start jconsole directly.
Connect to a local or remote JMX server using JConsole with security disabled:
-
Ensure that the local or remote Oracle Stream Analytics server is running with security disabled.
For more information, see Disable Security.
-
Launch
jconsoleusing thewlevsjconsole.cmdorwlevsjconsole.shscript located in the/Oracle/Middleware/my_oep/oep/bindirectory.-
To connect to a local Oracle Stream Analytics server, enter:
prompt> wlevsjconsole.cmd
-
To connect to a remote Oracle Stream Analytics server, enter:
prompt> wlevsjconsole.cmd
HOST-NAME:PORTWhere
HOST-NAMEis the name of the remote host andPORTis theNet IOport as configured in the remote host's/Oracle/Middleware/my_oep/user_projects/domains/myDomain/defaultserver/config/ config.xmlfile.
The script automatically connects to the JMX server and the
jconsolebrowser opens and provides access to Oracle Stream Analytics MBeans as Figure 11-5 shows. -
