6 Monitoring and Auditing Web Services
Note:
Only a subset of the monitoring features described in this chapter apply to Java EE web services.
From the Web Services application summary page in Fusion Middleware Control, you can do the following:
-
Monitor web services faults, including Security, Reliable Messaging, MTOM, Management, and Service faults.
-
Monitor Security failures, including authentication, authorization, message integrity, and message confidentiality failures.
-
Configure your web services ports, including enabling and disabling the port, attaching policies to web services, and enabling or disabling policies.
The Application home page also displays select web service details if the application includes web services.
For more information, refer to the following sections:
6.1 Overview of Monitoring Web Services
This section contains the following sections:
-
Viewing Web Service Statistics for an Individual Web Service
-
Overview of Viewing the Security Violations for a Web Service
In addition to the monitoring features described in this chapter, see "Analyzing Policy Usage" in Securing Web Services and Managing Policies with Oracle Web Services Manager to analyze how policies are used by one or more web services.
6.1.1 When Are Web Service Statistics Started or Reset?
The statistics described in this chapter are started or reset when any one of the following events occur:
-
When the application is being deployed for the first time.
-
When the application is redeployed.
-
If the application is already deployed, and the hosting server is restarted.
6.1.2 Viewing Web Service Statistics for a Server Instance
The server-side web services page displays statistics for all of the web services on that server.
To view the web service statistics for a server:
For Java EE web services, the following statistics are displayed in tabular format for each web service running on the server:
-
Web Service Name—Name of the web service.
-
Application name—Name of the application that contains the web service.
-
Endpoint name—Name of the web service endpoint. Click the endpoint name to view the Web Service Endpoint page.
-
Invocation count—Number of invocation requests to this endpoint.
-
Response count—Number of responses generated from
-
Response error count—Number of errors encountered during responses.
-
Average execution time—Average time, in milliseconds, to execute the web service.
-
Average response time—Average time, in milliseconds, to receive a response from the web service.
For Oracle Infrastructure web services, the following statistics are displayed in tabular format for each web service running on the server:
-
Web Service Name—Name of the web service.
-
Application name—Name of the application that contains the web service.
-
Endpoint name—Name of the web service endpoint. Click the endpoint name to view the Web Service Endpoint page.
-
Invocations completed—Total number of completed requests to this endpoint.
-
Average invocation time—Average time (in milliseconds) for the web service to send a response, in milliseconds.
-
Total faults—Total number of failed requests.
For RESTful services, the following statistics are displayed in tabular format for each web service running on the server:
-
Application name—Name of the application that contains the RESTful web service.
-
Module name—Name of the module for the RESTful service.
-
Name—RESTful application name. Click the name to view the RESTful Service Application page.
-
Invocation count—Number of times that the RESTful web service was invoked.
-
Error count—Number of errors that the RESTful web service incurred.
-
Average execution time—Average time (in milliseconds) for all RESTful web service executions.
6.1.3 Overview of Web Service Statistics for an Application
The following sections describe how to view web services statistics based on the type of application:
6.1.3.1 Viewing Web Service Statistics for a SOA Composite Application
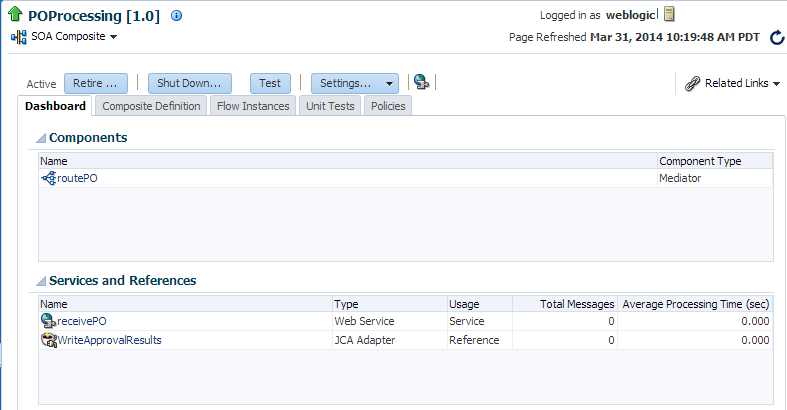
In Fusion Middleware Control, the dashboard for a SOA composite application displays the basic monitoring information for all services and references in the composite application, as shown in Figure 6-1.
To navigate to the dashboard page for a SOA composite application:
For the SOA composite services and references, the following web service application-level statistics are displayed:
-
Name—Name of the service or reference.
-
Type—Type of service or reference
-
Usage—Service or reference.
-
Total Messages—Total number of messages.
-
Average Processing Time (sec)—Average processing time, in seconds.
Figure 6-1 Dashboard for SOA Composite Application
6.1.3.2 Viewing Web Service Statistics for a Non-SOA Oracle Infrastructure Web Service Application
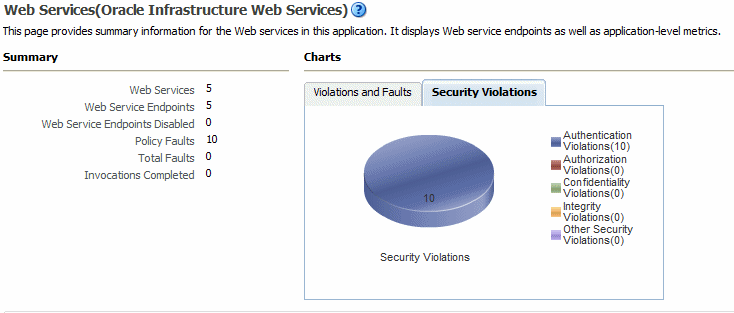
In Fusion Middleware Control, the Web Services summary page for an application displays the collective Summary and fault/violation information for all web services in the application, as shown in Figure 6-2.
The Charts section shows a graphical view of all security faults for a web service.
To navigate to the Web Service Summary page for a non-SOA Oracle Infrastructure web service application:
For Oracle Infrastructure web services, the following web service application-level statistics are displayed:
-
Web Services—Total number of web services in the application.
-
Web Service Endpoints—Total number of endpoints used by web services in this application.
-
Web Service Endpoints Disabled—Total number of endpoints assigned to web services which have been disabled.
-
Policy Faults—Number of web service requests that failed due to a policy fault. Specifies the total number since the application was last restarted.
-
Total Faults—Total number of failed requests, including security, reliable messaging, MTOM, management, and service faults. Specifies the total number since the application was last restarted.
-
Invocations Completed—Total number of client requests to the web service since the application was last restarted.
Figure 6-2 Web Services Performance Summary and Charts for an Application
6.1.3.3 Viewing the Web Service Statistics for a Java EE Application
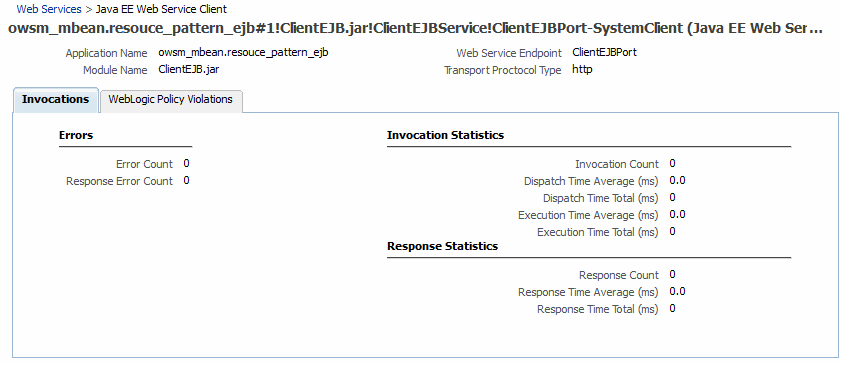
In Fusion Middleware Control, the Web Services summary page for a Java EE application, including SOAP and RESTful services, displays the collective Summary and fault/violation information for all web services in the application, as shown in Figure 6-3.
To navigate to the Web Service Summary page for a Java EE web service application:
For Java EE web services, including SOAP and RESTful web services, the following web service application-level statistics are displayed:
-
Server Name—Server on which the application is deployed.
-
Web Services—Number of web services in the application.
-
Web Service Endpoints—Total number of endpoints used by web services in this application.
-
Number of RESTful Applications—Total number of RESTful applications registered with this web service.
-
Number of RESTful Resources—The number of resources available to the RESTful application.
-
Java EE Web Service Clients—Number of run-time client instances in the application.
-
Java EE Web Service Client Ports—Number of web service client ports in the application to which you can attach OWSM policies.
6.1.4 Viewing Web Service Statistics for an Individual Web Service
The Web Service Details section of the Web Services Summary page for an application displays statistics on a per-web service basis, as shown in Figure 6-4. For information about navigating to the Web Services Summary page for an application, see "Overview of Web Service Statistics for an Application".
The following statistics are displayed for Java EE web services:
-
Name—Name of the web service. Expand the web service to display the web service endpoint.
-
Invocation Count—Number of invocation requests to this endpoint.
-
Response Error Count—Number of errors encountered during responses.
-
Response Count—Number of responses
-
Average Execution Time (ms)—Average time, in milliseconds, to execute the web service.
-
Average Response Time (ms)—Average time, in milliseconds, to receive a response from the web service.
The following statistics are displayed for RESTful web services:
-
Module Name and RESTful Application Name—Name of the module and RESTful application. Click the RESTful application name to view the RESTful Service Application page.
-
Resource Name—Name of the RESTful resource.
-
Resource Type—Type of the RESTful resource.
-
Resource Path—URI of the RESTful resource.
-
Invocation Count—Number of invocation requests to this endpoint.
-
Average Execution Time (ms)—Average time, in milliseconds, to execute web services.
The following statistics are displayed for Oracle Infrastructure web services:
-
Name—Name of the web service. Expand the web service to display the web service endpoint.
-
Endpoint Enabled—Flag that specifies whether the web service is enabled or disabled. For Oracle Infrastructure web service providers, this field displays n/a.
-
Start Time—Time the web service was started.
-
Invocations Completed—Number of completed requests to this endpoint.
-
Average Invocation Time—Average time for all web service invocations to be processed.
-
Policy Faults—Number of failed requests because a policy was not successfully executed.
-
Total Faults—Total number of failed requests.
Figure 6-4 Web Service Statistics for Individual Oracle Infrastructure Web Services

Description of "Figure 6-4 Web Service Statistics for Individual Oracle Infrastructure Web Services"
6.1.5 Viewing Operation Statistics for a Web Service Endpoint
Follow this procedure to view statistics for a web service endpoint. To view statistics for individual operations, see "Viewing Statistics for a Java EE Web Service Operation".
To display operation statistics for a particular web service endpoint:
6.1.6 Viewing Statistics for a Java EE Web Service Operation
The individual web service operations are displayed on the Operations tab of the Web Service Endpoint page. This procedure applies only to Java EE web service operations.
To view the statistics for an individual Java EE web service operation:
- Navigate to the Web Service Operation page as described in "Viewing the Details for a Java EE Web Service Operation".
- Click the name of an operation to view its statistics.
The Web Service Operation page displays the following statistics:
| Element | Description |
|---|---|
| Application Name | The name of the application that this operation is associated with. |
| Web Service Name | The name of the web service that this operation is associated with. |
| Endpoint Name | The name of the endpoint that this operation is associated with. |
| Operation Name | The name of the web service operation. |
| Endpoint URI | The URI of the endpoint that this operation is associated with. |
Errors
The Errors section of the Web Service Operation page displays the following error statistics:
| Element | Description |
|---|---|
| Error Count | Number of errors sending or receiving a request. |
| Last Error | Last error that occurred processing a request. |
| Last Error Time | Time on WebLogic Server of the last error for a request (sending or receiving) was detected expressed as the number of milliseconds since midnight, January 1, 1970 UTC. |
| Response Error Count | Total number of errors from responses generated from operation invocations. |
| Last Response Error | Last response error to arrive for this client/service (or null if no errors have occurred). |
| Last Response Error Time | Time on WebLogic Server of the last error sending or receiving a response (or 0 if no failures have occurred) expressed as the number of milliseconds since midnight, January 1, 1970 UTC. |
Invocation Statistics
The Invocation Statistics section of the Web Service Operation page displays the following invocation statistics:
| Element | Description |
|---|---|
| Invocation Count | Total number of operation invocations in the current measurement period. |
| Last Invocation Time | Time of the last operation request to be sent or received (or 0 if no requests have been sent or received). |
| Average Dispatch Time (ms) | Average operation dispatch time (in milliseconds) for the current measurement period. Dispatch time refers to the time for WebLogic Server to process the invocation. The measurement period typically starts when WebLogic Server is first started. |
| Dispatch Time Total (ms) | Total time (in milliseconds) for all operation dispatches in the current measurement period. Dispatch time refers to the time for WebLogic Server to process the invocation. The measurement period typically starts when WebLogic Server is first started. |
| Dispatch Time High | Longest operation dispatch time for the current measurement period. Dispatch time refers to the time for WebLogic Server to process the invocation. The measurement period typically starts when WebLogic Server is first started. |
| Dispatch Time Low | Shortest operation dispatch time for the current measurement period. Dispatch time refers to the time for WebLogic Server to process the invocation. The measurement period typically starts when WebLogic Server is first started. |
| Average Execution Time (ms) | Average operation execution time (in milliseconds). |
| Execution Time Total (ms) | Total time (in milliseconds) for all operation executions. |
| Execution Time High | Longest operation execution time. |
| Execution Time Low | Shortest operation execution time. |
Response Statistics
The Response Statistics section of the Web Service Operation page displays the following response statistics:
| Elements | Description |
|---|---|
| Response Count | Total number of responses generated from operation invocations. |
| Last Response Time | Time on WebLogic Server of the last response to arrive for this client/service (or 0 if no responses have been received) expressed as the number of milliseconds since midnight, January 1, 1970 UTC. |
| Average Response Time (ms) | Average response time (in milliseconds) from the responses generated from operation invocations. |
| Response Time Total (ms) | Total time (in milliseconds) for all responses generated from operation invocations. |
| Response Time High | Longest response time from the responses generated from operation invocations. |
| Response Time Low | Lowest response time from the responses generated from operation invocations. |
6.1.7 Viewing Statistics for Java EE Web Service Clients
To display web service statistics for the run-time client instances in a Java EE application:
6.1.8 Viewing Statistics for RESTful Resources
To display web service statistics for the resources in a RESTful web service:
6.1.9 Viewing Statistics for SOA Binding Components
You can monitor service and reference binding components in SOA composite applications, including instances, faults, and rejected messages. For complete details, refer to the following sections in Administering Oracle SOA Suite and Oracle Business Process Management Suite:
To view statistics for SOA binding components:
- Navigate to the SOA composite application, as described in "Viewing the Web Services and References in a SOA Composite".
- In the Services and References section, select a specific service or reference.
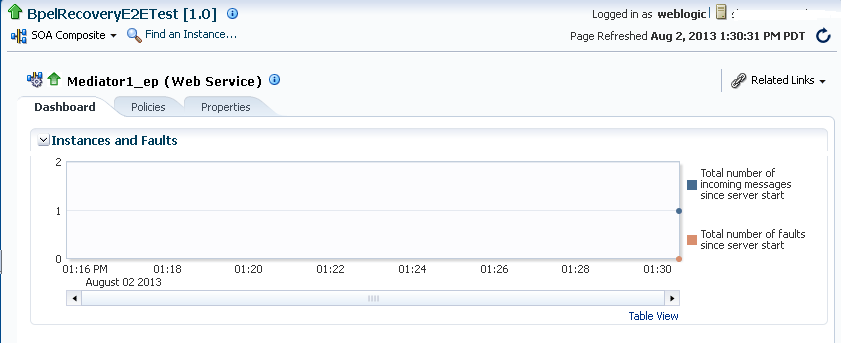
If you select a service binding component that is a JCA adapter, web service, or REST service, the Dashboard page displays a graphic representation of the total number of incoming messages and faults since server startup, as shown in Figure 6-6.
Figure 6-6 Statistics for SOA Binding Components
6.1.10 Overview of Viewing the Security Violations for a Web Service
Follow the procedures listed below to view security violations for a web service:
6.1.10.1 Viewing the Security Violations for an Oracle Infrastructure Web Service
To view the security violations for an Oracle Infrastructure web service:
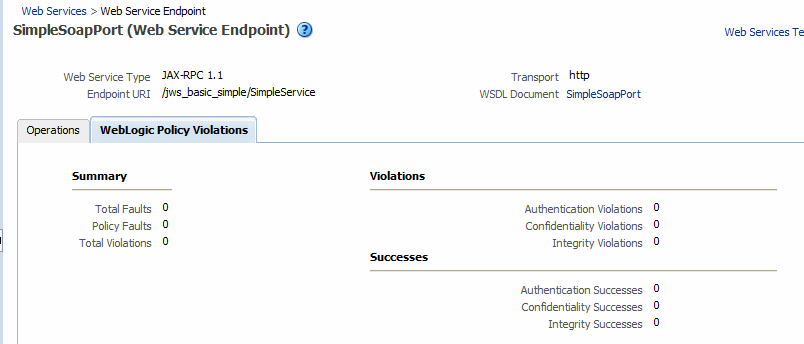
6.1.10.2 Viewing the Security Violations for a Java EE JAX-WS Web Service
To view the security violations for a Java EE JAX-WS web service:
6.2 Auditing Web Services
Auditing describes the process of collecting and storing information about security events and the outcome of those events. An audit provides an electronic trail of selected system activity.
An audit policy defines the type and scope of events to be captured at run time. Although a very large array of system and user events can occur during an operation, the events that are actually audited depend on the audit policies in effect at run time. You can define component- or application-specific policies, or audit individual users.
You configure auditing for system components, including web services, and applications at the domain level using the Audit Policy page. You can audit SOA and ADF services.
The following table summarizes the events that you can audit for web services and the relevant component.
Table 6-8 Auditing Events for Web Services
| Enable auditing for the following web service events. . . | Using this system component. . . |
|---|---|
| OWSM—Agent For more information, see "OWSM-AGENT Events and Attributes". |
Note: In this case, events are logged for both security and non-security web service invocations. | Oracle web services For more information, see "Oracle Web Services Events and Attributes". |
| OWSM—Policy Manager Note: The Policy Manager audits both local policy attachments and global policy attachments for policy sets. For more information, see "OWSM-PM-EJB Events and Attributes". |
| OWSM—Policy Attachment Note: The Policy Attachment audits only local policy attachments. For more information, see "Web Services Policy Attachment Events and Attributes". |
You can also audit the events for a specific user, for example, you can audit all events by an administrator.
For more information about configuring audit policies, see "Configuring and Managing Auditing" in Securing Applications with Oracle Platform Security Services.
The following sections describe how to define audit policies and view audit data:
6.2.1 Configuring Audit Policies
Follow the steps in this section to configure audit policies. For more information, see "Manage Audit Policies for Java Components with Fusion Middleware Control" in Securing Applications with Oracle Platform Security Services.
6.2.2 Managing Audit Data Collection and Storage
To manage the data collection and storage of audit information, you need to perform the following tasks:
-
Set up and manage an audit data repository.
You can store records using one of two repository modes: file and database. It is recommended that you use the database repository mode. The Oracle Business Intelligence Publisher-based audit reports only work in the database repository mode.
-
Set up audit event collection.
For more information, see "Managing the Audit Data Store" in Securing Applications with Oracle Platform Security Services.
6.2.3 Viewing Audit Reports
For database repositories, data is exposed through pre-defined reports in Oracle Business Intelligence Publisher.
A number of predefined reports are available, such as: authentication and authorization history, OWSM policy enforcement and management, and so on. For details about generating and viewing audit reports using Oracle Business Intelligence Publisher, see "Using Audit Analysis and Reporting" in Securing Applications with Oracle Platform Security Services.
For file-based repositories, you can view the bus-stop files using a text editor and create your own custom queries.
