11 Monitoring Oracle Access Management Performance and Access Manager Health
Monitoring performance refers to observing (viewing) performance metrics to make yourself aware of the state of specific components of Oracle Access Management.
Monitoring the server health can be performed through heartbeat URL or Health Check Framework.
The heartbeat URL performs a set of predefined tests and returns only the https status code with no additional information.
The Health Check Framwework supports aditional information in the body of the http response. The information can indicate the nature of the test and the result of the test information. The tests performed can also be controlled either by configuration or request itself.
The tests currently supported depend exclusively on DMS metrics and log information.
This chapter contains the following sections on monitoring Oracle Access Management performance and Access Manager health.
-
Monitoring Server Metrics Using Oracle Access Management Console
- Monitoring Server Health with Health Check Framework
In addition to these, the admin server exposes DMS metrics in JMX. Refer to the displayOAMMetrics WLST command.
See Also:
-
Monitoring Performance and Logs with Fusion Middleware Control if you are using Oracle Enterprise Manager Fusion Middleware Control
Introduction to Performance Monitoring
Component performance metrics is collected in memory during the completion of particular events. These metrics are kept only in memory so there are several mechanisms to extract and display them including (but not limited to) Oracle Enterprise Manager Fusion Middleware Control (FMW), the Oracle Dynamic Monitoring Service (DMS) and the Oracle Process Manager and Notification Server (OPMN).
-
FMW Control is a Web browser-based, graphical user interface that offers monitoring options. See Monitoring Performance and Logs with Fusion Middleware Control for details.
-
DMS uses the DMS Spy Servlet to provide access to DMS metric data from a web browser. Information is categorized by Noun Types; for Oracle Access Management the prefix is OAMS.OAM_. See Monitoring Metrics Using the DMS Console.
-
dmsdump is provided by DMS to take metrics from the servers based on definitions in a dms configuration file. There are many OAM metrics exposed when dms dumps are generated. See About Dynamic Monitoring Service (DMS) in the Oracle Fusion Middleware Performance and Tuning Guide.
-
OPMN provides access to metrics using dmsdump.
Monitoring Server Metrics Using Oracle Access Management Console
Users with valid Oracle Access Management Administrator credentials can log into the Oracle Access Management Console and monitor various performance metrics.
This section provides the following topics:
Monitoring Server Instance Performance
Users with valid Oracle Access Management Administrator credentials can monitor performance for Access Manager using the Monitoring command on the Actions menu under the System Configuration tab using the Oracle Access Management Console.
See Understanding the Oracle Access Management Console for details.
Before you begin, the OAM Server must be running.
-
From the Oracle Access Management Console, click Server Instances and the desired server instance.
-
Server Instance:
-
From the Actions menu in the navigation tree, click Monitor Menu.
-
On the Monitor page, click the desired subtab to view results for the server instance:
- Server Processes Overview
- Session Operations
- Server Operations
- WebGates
-
Proceed to Oracle Access Manager Server Metrics
-
-
See also, "OAM Proxy Metrics and Tuning".
Oracle Access Manager Server Metrics
This topic provides a look at the Server metrics available through the Monitor option from the Server Instances tab in the Configuration section of the console.
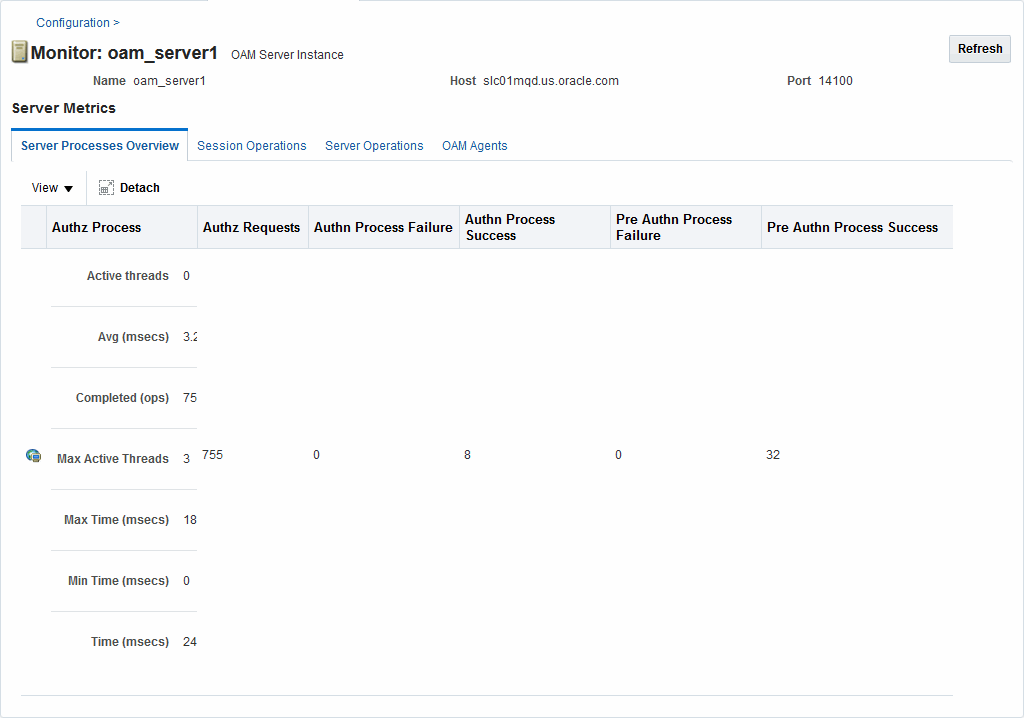
Figure 11-1 shows the Server Processes page.
Figure 11-1 Server Processes Overview Page

Description of "Figure 11-1 Server Processes Overview Page"
Server Processes Overview provides the following OAM Server events, organized in individual columns on the tab.
-
Authorization Process
-
Authorization Requests
-
Authentication Process Failure
-
Authentication Process Success
-
Pre Authentication Process Failure
-
Pre Authentication Process Success
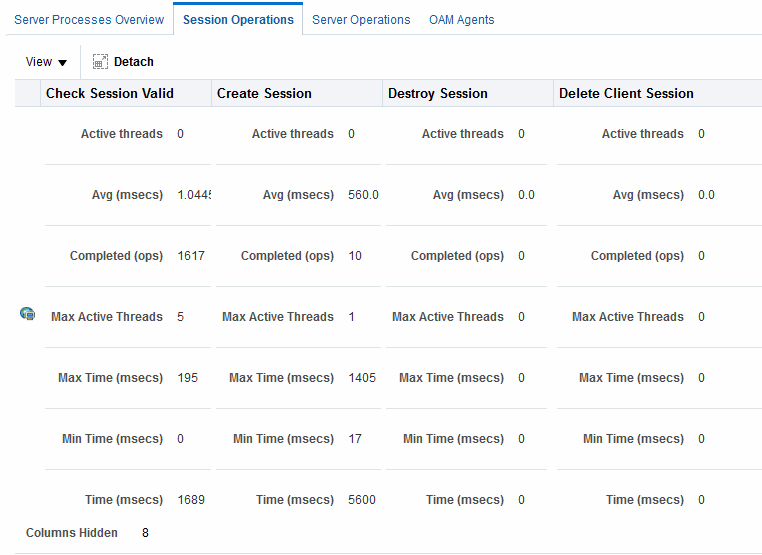
Figure 11-2 shows the Session Operations tab.
Figure 11-2 OAM Server Metrics: Session Operations Monitoring Page

Description of "Figure 11-2 OAM Server Metrics: Session Operations Monitoring Page"
-
Check Session Valid
-
Check Session Valid Failure
-
Check Session Valid Success
-
Create Session
-
Create Session Failure
-
Create Session Success
-
Destroy Session
-
Destroy Session Failure
-
Destroy Session Success
-
Delete Client Session
-
Delete Client Session Failure
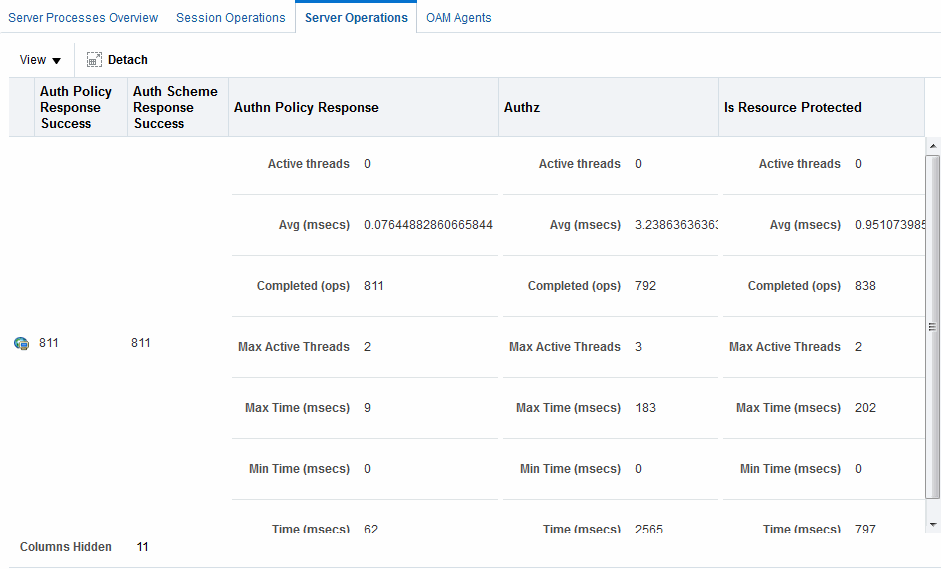
Figure 11-3 shows the Server Operations tab.
Figure 11-3 OAM Server Metrics: Server Operations Tab

Description of "Figure 11-3 OAM Server Metrics: Server Operations Tab"
-
Authentication Policy Response Failure
-
Authentication Policy Response Success
-
Authentication Scheme Response Failure
-
Authentication Scheme Response Success
-
Authentication Failure
-
Authentication Failure Responses
-
Authentication Policy Response
-
Authentication Requests
-
Authentication Scheme Response
-
Authorization Failure
-
Authorization Failure
-
Authorization Process Failure
-
Authorization Process Success
Figure 11-4 shows the OAM Server Metrics: WebGates tab with all available metrics showing.
Figure 11-4 OAM Server Metrics: WebGates Tab

Description of "Figure 11-4 OAM Server Metrics: WebGates Tab"
WebGate performance metrics include:
-
Agent Name
-
Agent Status
-
Version
OAM Proxy Metrics and Tuning
Administrators can tune the performance of OAM proxy through the Java EE container Administration Console.
This section provides the following topics:
See Also:
OAM Proxy Metrics
Throughput refers to the number of requests processed per second. Latency refers to the time required to process a particular request. There is less than a 20% latency increase with the introduction of a proxy between WebGate and OAM Server.
Table 11-1 lists the various OAM Proxy metrics available.
Table 11-1 OAM Proxy Metrics
| Metric | Description |
|---|---|
|
handshakes.active |
Number of active threads doing handshake |
|
handshakes.avg |
Average time spent performing initial handshake |
|
handshakes.completed |
Number of times an initial handshake has been executed |
|
handshakes.maxTime |
Maximum time spent performing initial handshake |
|
handshakes.minTime |
Minimum time spent performing initial handshake |
|
handshakes.time |
Total time spent performing initial handshake |
|
failedHandshakes.count |
Count of failed handshakes |
|
peerCompatibilityFailures.count |
Count of how many Peer Compatibility Check Failures have happened |
|
openSecurityMode.count |
Count of how many Open Security Mode handshakes have happened |
|
SSLSecurityMode.count |
Count of how many SSL Security Mode handshakes have happened |
|
negotiateSecurityMode.active |
Number of active threads doing security mode negotiation |
OAM Proxy Server Tuning Parameters
Performance of the OAM Proxy can be tuned by changing its configuration through the Java EE container Administration Console.
Both the Java EE container Administrator and the Oracle Access Management Administrator can tune performance using the Java EE container Administration Console, which is outside the scope of this book.
Table 11-2 provides the tuning parameters for the OAM Proxy.
Table 11-2 OAM Proxy Tuning Parameters
| Purpose | Parameter | Type | Value | Description |
|---|---|---|---|---|
|
Denial of Service Attacks |
ConnectionValidationInterval |
Integer |
120 |
The time interval in seconds for validating the connections periodically for denial of service attacks |
|
Denial of Service Attacks |
BacklogQueue |
Integer |
50 |
Maximum length of backlog queue |
|
Denial of Service Attacks |
MaxNAPHandShakeTime |
Integer |
100 |
The maximum time in milliseconds within which the client should complete the NAP handshake with client. If NAP handshake over a connection is not completed within this time, the connection will be marked as malicious |
Monitoring Metrics Using the DMS Console
Oracle Access Management uses the Oracle Dynamic Monitoring Systems (DMS) to measure application-specific performance information for OAM Servers and registered Agents. The metrics can be used to monitor the time spent in a particular area, or track particular occurrences or state changes.
To access the DMS console, type the following URL in a browser window and log in with your Oracle Access Management Administrator credentials.
http:// <example_AdminServer:Port/dms/Spy
Once logged into the DMS console you can monitor metrics as discussed in the following sections.
Monitoring OAM Metrics
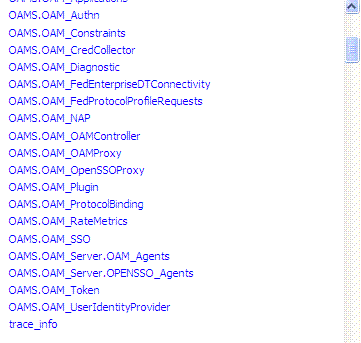
Tthe OAM metrics can be reviewed In the DMS Metric Tables panel.
You can access metrics regarding OAM as illustrated in Figure 11-5. Click the desired metric from those listed to view the results on the right-side of the console.
Monitoring the Health of an Access Manager Server
Access Manager Services are business critical and must always be available to control user access to an organization's protected web services and applications. Because hardware, network connectivity issues and other failures can happen, HeartBeat monitoring can be leveraged by Load Balancers to ensure user traffic is routed to healthy OAM Servers.
For example, when there is a firewall installed between a User Agent or WebGate and the Access Manager server, perimeter devices can check availability of the Access Manager server (its health) by hitting its HeartBeat URL. The following sections contain details.
Understanding WebGate and Access Manager Communications
The firewall determines this connection is idle after 30-40 minutes of inactivity (depending on its configuration) and terminates the socket connection but does not inform/notify the WebGate or Access Manager server. In this case, when a request for a resource arrives at the WebGate and it sends a OAP message to the Access Manager server, it uses the existing connection and waits for a reply. Because the connection was dropped by the firewall, the WebGate does not receive any reply; so it waits for the TCP timeout. Following the TCP timeout, WebGate understands the message channel is of no use and starts the process to get a new message channel. TCP timeout is OS specific and may vary from several minutes to hours which makes the WebGate unable to process user requests.
Note:
The setKeepAlive WebGate parameter ensures that load balancers do not drop the OAP connection. See Table 15-2 for details.
Monitoring Access Manager Server Health
The OAM monitoring model allows Web Tier components (load balancers) to ping an OAM Managed Server's HeartBeat endpoint at a scheduled interval over HTTP(S). This allows Web Tier components to route incoming HTTP traffic away from unhealthy OAM Managed Server(s).
Every OAM Managed Server exposes this HeartBeat URL:
Scheme://ManagedServerHost:ManagedServerPort/oam/server/HeartBeat
In this URL, the following is true:
-
scheme = https | http
-
ManagedServerHost = Host name of the Access Manager WLS Managed Server
-
ManagedServerPort = Port used by the Access Manager WLS Managed Server
The HeartBeat URL works as follows:
Note:
Neither the health status test results or check results can be communicated in the body of the HTTP Response. A successful heartbeat check will return the HTTP code 200.
WARNING:
OAM Server health check raises a WARNING on the weblogic admin console for OAM if the server is configured to have a maximum heap size less than 1.5 GB.Monitoring Server Health with Health Check Framework
HealthCheck Framework enables health check on servers.
The following sections provides information on the health checks
Introduction to HealthCheck Framework
HealthCheck Framework enables health check on servers. These checks can be performed using REST API or by scheduling periodic checks on the server. Each schedule can be associated with a specified set of tests to be run.
The REST API invocation performs preconfigured health-check tests on the server and returns the status of the test runs.
The framework supports notification of issues by components through the /health/check API. If the test lists are not specified in the request, the results of a default set of tests are returned.
The framework provides aggregating services to health check tests. These aggregating services allows the tests to cumulate results over a configured window of time.
The test results are mapped to actions to be performed on the server. These actions are based on the test and the health result. The action and the mapping is configured in the oam-config.xml file.
These actions can include subscribing to the Weblogic Health Check callback and setting the Weblogic server state appropriately. For more information, see Configure server health monitoring in Oracle® Fusion Middleware Administering Oracle WebLogic Server with Fusion Middleware Control
Understanding HealthCheck Test Configuration
The HealthCheck Framework provides preconfigured health-check tests that are run when the health check API is invoked or during a scheduled Health Check.
TestList setting under the HealthCheck element in the oam-config.xml file.<?xml version="1.0" encoding="UTF-8"?>
<Configuration xsd:schemaLocation="http://higgins.eclipse.org/sts/Configuration Configuration.xsd" Path="/DeployedComponent/Server/NGAMServer/Profile/HealthCheck">
<Setting Name="HealthCheck" Type="htf:map">
<Setting Name="TestLists" Type="htf:list">
<Setting Name="0" Type="hcf:testList">
<Setting Name="Id" Type="xsd:string">TL001</Setting>
<Setting Name="Name" Type="xsd:string">TL001</Setting>
<Setting Name="Lang" Type="xsd:string">EN</Setting>
<Setting Name="Validity" Type="xsd:duration">PT5M</Setting>
<Setting Name="TestList" Type="htf:list">
<Setting Name="0" Type="xsd:string">HeapSizeCheck</Setting>
<Setting Name="1" Type="xsd:string">FreeHeapCheck</Setting>
<Setting Name="2" Type="xsd:string">LoginFailureCheck</Setting>
<Setting Name="3" Type="xsd:string">DirectoryOutage</Setting>
<Setting Name="4" Type="xsd:string">DirectoryLatency</Setting>
<Setting Name="5" Type="xsd:string">AuthenticationLatency</Setting>
<Setting Name="6" Type="xsd:string">AuthorizationLatency</Setting>
</Setting>
</Setting>
</Setting>
<Setting Name="Schedules" Type="htf:list">
<Setting Name="0" Type="hcf:schedule">
<Setting Name="Id" Type="xsd:string">TS001</Setting>
<Setting Name="Name" Type="xsd:string">TS001</Setting>
<Setting Name="Desc" Type="xsd:string">Default schedule. Runs every minute.</Setting>
<Setting Name="Lang" Type="xsd:string">EN</Setting>
<Setting Name="Cron" Type="xsd:string">* * * * *</Setting>
<Setting Name="Enabled" Type="xsd:boolean">true</Setting>
<Setting Name="TestListId" Type="xsd:string">TL001</Setting>
</Setting>
</Setting>
<Setting Name="ComponentTests" Type="htf:list">
<Setting Name="0" Type="hcf:compTest">
</Setting>
<Setting Name="1" Type="hcf:compTest">
</Setting>
<Setting Name="2" Type="hcf:compTest">
</Setting>
<Setting Name="3" Type="hcf:compTest">
<Setting Name="Id" Type="xsd:string">DirectoryOutage</Setting>
<Setting Name="Name" Type="xsd:string">DirectoryOutage</Setting>
<Setting Name="Lang" Type="xsd:string">EN</Setting>
<Setting Name="Criticality" Type="hcf:criticality">AUXILIARY </Setting>
<Setting Name="Timeout" Type="xsd:duration">P0Y0M0DT0H0M1.000S</Setting>
<Setting Name="Class" Type="xsd:string">oracle.security.am.healthcheck.featuretest.dms.DmsMetricsDrivenChecks</Setting>
<Setting Name="Parameters" Type="htf:list">
<Setting Name="0" Type="xsd:string">/*Directory outages are detected based on LIBOVD-40067 messages that are issued every minute.*/refid = LogsUtil.recordLogMessage("oracle.ods.virtualization.engine.backend.jndi.adapter1", "LIBOVD-40067");windowSize = LogsUtil.getLogOccurrencesWindow(refid);if (windowSize <> 180000.0) { LogsUtil.setLogOccurrencesWindow(refid, 180000.0); windowSize = LogsUtil.getLogOccurrencesWindow(refid);};count = LogsUtil.getLogOccurrences(refid);ScriptUtil.removeVariable("refid");count < 0.5;</Setting>
</Setting>
</Setting>
<Setting Name="4" Type="hcf:compTest">
</Setting>
<Setting Name="5" Type="hcf:compTest">
</Setting>
<Setting Name="6" Type="hcf:compTest">
</Setting>
</Setting>
</Setting>
</Configuration>
You can use the GET and PUT methods of the /iam/admin/config/api/v1/config API to fetch and update the configuration. For more information, see Configuring Scheduled Health Checks.
| HealthCheck Test | Description |
|---|---|
| HeapSizeCheck |
Helps identify the misconfigured servers. DMS metrics are invoked to determine the heap size. If the heapsize is less than the configured value, the test is considered failed and the server is put in warning state. |
| FreeHeapCheck |
Helps determine if the server is a candidate for throttling. DMS metrics are invoked to determine free heap. If the ratio of the free heap to the max heap, in percentage, is less than the value of the threshold variable |
| LoginFailureCheck |
Helps determine user login failure rate. |
| DirectoryOutage |
The server tests for directory state every minute. If there is an outage, log messages are generated. Such log messages, for example, LIBOVD-40067 are detected by this test, resulting in test failure, and the server is put on failed state. |
| DirectoryLatency |
Directory latency increase is detected on current samples in the configured sampling window. If the latency is greater than the configured allowed value, the test is considered failed, and the server is put in warning state. |
| AuthenticationLatency |
Authentication latency increase is detected on current samples in the configured sampling window. If latency is greater than the configured allowed value, the test is considered failed, and the server is put in warning state. |
| AuthorizationLatency |
Authorization latency increase is detected on current samples in the configured sampling window. If latency is greater than the configured allowed value, the test is considered failed, and the server is put in warning state. |
Running Health Checks Using REST API
You can use the /health/check REST API to run the preconfigured tests on the servers.
Run the following REST API command to perform health check on the servers:
curl -X GET --header 'Authorization:'
--header 'Accept: application/json'
'http://<ManagedServerHost>:<ManagedServerPort>/health/check'
-d {report: summary, testlistid}
The following table provides the parameter details:
Table 11-3 Health Check REST API Parameters
| Parameters | Descritpion |
|---|---|
| Report | Determines the content in the response. Following values are supported.
|
| testlistid | Optional. Specifies the collection of tests to run. If this parameter is not provided then all the tests that are listed in the testList element with id restTestListId in the oam-config.xml file are run.
|
Configuring Scheduled Health Checks
The HealthCheck framework allows scheduled health checks on server. A collection of tests associated with the specified schedule is run periodically. Multiple schedules can run the configured tests.
The periodic health checks are performed based on the parameters and values configured under the HealthCheck element in the oam-config.xml file.
To create a schedule for the specified set of tests, follow the steps as described:
- Fetch the configuration settings using the admin config API. Specify the path to the
HealthChecksetting, for example:http://<AdminServerHost>:<AdminServerPort>/iam/admin/config/api/v1/config ?path=/DeployedComponent/Server/NGAMServer/Profile/HealthCheck - Add the tests that are required to be run to the
TestListssetting as shown.<Setting Name="TestLists" Type="htf:list" Path="/DeployedComponent/Server/NGAMServer/Profile/HealthCheck/TestLists"> <Setting Name="0" Type="hcf:testList"> <Setting Name="Id" Type="xsd:string">TL001</Setting> <Setting Name="Name" Type="xsd:string">TL001</Setting> <Setting Name="Lang" Type="xsd:string">EN</Setting> <Setting Name="Validity" Type="xsd:duration">-PT5M</Setting> <Setting Name="TestList" Type="htf:list"> <Setting Name="0" Type="xsd:string">HeapSizeCheck</Setting> <Setting Name="1" Type="xsd:string">FreeHeapCheck</Setting> <Setting Name="2" Type="xsd:string">LoginFailureCheck</Setting> <Setting Name="3" Type="xsd:string">DirectoryOutage</Setting> <Setting Name="4" Type="xsd:string">DirectoryLatency</Setting> <Setting Name="5" Type="xsd:string">AuthenticationLatency</Setting> <Setting Name="6" Type="xsd:string">AuthorizationLatency</Setting> </Setting> </Setting> <Setting Name="1" Type="hcf:testList"> <Setting Name="Id" Type="xsd:string">LoginTestList</Setting> <Setting Name="Name" Type="xsd:string">LoginTestList</Setting> <Setting Name="Lang" Type="xsd:string">EN</Setting> <Setting Name="Validity" Type="xsd:duration">-PT5M</Setting> <Setting Name="TestList" Type="htf:list"> <Setting Name="0" Type="xsd:string">LoginFailureCheck</Setting> </Setting> </Setting> <Setting Name="2" Type="hcf:testList"> <Setting Name="Id" Type="xsd:string">LDAPOutageTestList</Setting> <Setting Name="Name" Type="xsd:string">LDAPOutageTestList</Setting> <Setting Name="Lang" Type="xsd:string">EN</Setting> <Setting Name="Validity" Type="xsd:duration">-PT5M</Setting> <Setting Name="TestList" Type="htf:list"> <Setting Name="0" Type="xsd:string">DirectoryOutage</Setting> </Setting> </Setting> <Setting Name="3" Type="hcf:testList"> <Setting Name="Id" Type="xsd:string">LatencyTestList</Setting> <Setting Name="Name" Type="xsd:string">LatencyTestList</Setting> <Setting Name="Lang" Type="xsd:string">EN</Setting> <Setting Name="Validity" Type="xsd:duration">-PT5M</Setting> <Setting Name="TestList" Type="htf:list"> <Setting Name="0" Type="xsd:string">DirectoryLatency</Setting> <Setting Name="1" Type="xsd:string">AuthenticationLatency</Setting> <Setting Name="2" Type="xsd:string">AuthorizationLatency</Setting> </Setting> </Setting> </Setting> - Add a schedule, for the tests to be run, under the
Schedulessetting. For example, to schedule the testLoginTestJobevery two minutes andLDAPOUTAGEJobevery 10 minutes, set the parameters as shown:<Setting Name="Schedules" Type="htf:list" Path="/DeployedComponent/Server/NGAMServer/Profile/HealthCheck/Schedules"> <Setting Name="1" Type="hcf:schedule"> <Setting Name="Id" Type="xsd:string">LoginTestJob</Setting> <Setting Name="Cron" Type="xsd:string">*/2 * * * *</Setting> <Setting Name="Enabled" Type="xsd:boolean">true</Setting> <Setting Name="TestListId" Type="xsd:string">LoginTest</Setting> </Setting> <Setting Name="2" Type="hcf:schedule"> <Setting Name="Id" Type="xsd:string">LDAPOUTAGEJob</Setting> <Setting Name="Cron" Type="xsd:string">*/10 * * * *</Setting> <Setting Name="Enabled" Type="xsd:boolean">true</Setting> <Setting Name="TestListId" Type="xsd:string">LDAPOUTAGE</Setting> </Setting> </Setting> - Update the configuration using the
PUTmethod of the admin config API as shown:curl -u username:password -H 'Content-Type: text/xml' -X PUT http://<AdminServerHost>:<AdminServerPort>/iam/admin/config/api/v1/config --data-binary @ConfigFile
Using the Health Script Evaluator
Health Check Framework includes a script evaluator tool, using which you can create health-check tests based on DMS metrics, and evaluate them within the tool.
The evaluator tool provides utility functions to extract values from the DMS sensors, and variables for capturing those values. The tool also supports branching along with arithmetic and boolean expressions for evaluating your tests.
The evaluator tool consists of a text area where you can input your scripts for evaluating. The results of the evaluation are displayed in the bottom panels.
Interim variables that are created during evaluation and the values after complete execution are displayed in the Variables Created panel.
The final value is displayed in the Exceptions and Returned Values panel.
Note:
The scripts must be created to return a boolean value indicating the result of the test.If a function is passed an invalid value, the returned exception may contain possible values for the parameter in the Exceptions and Returned Values panel.
You can access the health script evaluator from the following link:
http://<ManagedServerHost>:<ManagedServerPort>/iam/access/api/v1/health/script/evaluateClick Help in the evaluator tool for information about the syntax and details regarding the Functions, Branching, Variables and Expression that the tool supports. The Help also provides snippets of code that gets copied directly into the text area when you click them.
For information about all the available operations on the tool, refer to http://<ManagedServerHost>:<ManagedServerPort>/iam/access/api/v1/health/dms/info
You can use the sensors information and metrics listed in the following link to get the values for parameters added to the functions: http://<ManagedServerHost>:<ManagedServerPort>/iam/access/api/v1/health/dms/info?operation=sensors
Note:
After creating and evaluating your health-check scripts in the evaluator tool, you can also add your tests to the configuration file for scheduled checks. See Configuring Scheduled Health Checks for details.Building a Simple Health Check Test in the Evaluator Tool
This example helps identify misconfigured servers with heap size less than 1500000KB. Form the script as explained in the following steps and add it to the evaluator tool:
- To retrieve the heapsize configured on the server, use the Sensor function
DmsUtil.getMetricValue("type", "noun", "path", "sensorName", "metric")and assign its value tomaxHeapvariable.Refer to
http://<ManagedServerHost>:<ManagedServerPort>/iam/access/api/v1/health/dms/info?operation=sensorsto get the required details for the parameters of the function. In this example, the type isJVM_MemorySet, and nounHeap memory, path isPath:/JVM/MxBeans/memory/type/Heap memorysensorName ismaxand metric can bevalue. - Retrieve the units value using
DmsUtil.getMetricUnits(sensor, "metric")and assign it tounitsvariable . - Set a variable
heapThreshold = 1500000. - Compare the
maxheapwithheapThresholdusing the boolean>operator.
// Threshold determines free memory in percentage that triggers server criticality.
heapThreshold = 1500000;

maxHeap = DmsUtil.getMetricValue("JVM_MemorySet", "Heap memory", "/JVM/MxBeans/memory/type/Heap memory", "max", "value");
units = DmsUtil.getMetricUnits(DmsUtil.locateSensor("JVM_MemorySet", "Heap memory",
               "/JVM/MxBeans/memory/type/Heap memory", "max"), "value");

maxHeap > heapThreshold;
Click Evalaute. The tool returns the following response:
Sample Response
Variables Created
{heapThreshold=1500000.0, maxHeap=1864192, units=KB}
Exceptions and Returned Values
result:true
Example Test Scripts
The following examples provide additional health test scripts showing the various functions that the evaluator tool supports:
Example 11-1 User Login Failure
The following example is a script, testing the health of the system. It measures the number of user login failures within the specified window of time and returns results. Login failures above 90% of the user login, within two minutes and thirty seconds suggests problems with the system that might need immediate attention.
This script uses a Math function MathUtil.doCount() for counting the number of user authentication requests and failures. See Help in the evaluator tool for more information about Math functions.
/*
User Login Failure
*/
//Number of User login requests, when the test becomes effective
requestsThreshold = 100;
//Number of user login failures, in percentage
failedThreshold = 90;
//Free percentage averaged over two minutes and 30 seconds window
reqWinSize = 150000;  //2.5 * 60 * 1000;

windowSize = MathUtil.getAveWindowSize("LoginFailure","failed");
if (windowSize > reqWinSize) {
  MathUtil.setAveWindowSize("LoginFailure","failed", reqWinSize);
  windowSize = MathUtil.getAveWindowSize("LoginFailure","failed");
};

windowSize = MathUtil.getAveWindowSize("LoginFailure","users");
if (windowSize < reqWinSize) {
  MathUtil.setAveWindowSize("LoginFailure","users", reqWinSize);
  windowSize = MathUtil.getAveWindowSize("LoginFailure","users");
};
//Count of user authentications
MathUtil.doCount("LoginFailure","failed",DmsUtil.getMetricValue("OAMS.OAM_UserIdentityProvider", "UserIdentityProvider", "/OAMS/OAM/UserIdentityProvider", "authenticateUserFailure", "count"));
failed = MathUtil.getCount("LoginFailure","failed");

//Count of user authentication requests
MathUtil.doCount("LoginFailure","users",DmsUtil.getMetricValue("OAMS.OAM_UserIdentityProvider", "UserIdentityProvider", "/OAMS/OAM/UserIdentityProvider", "authenticateUser", "count"));

//The computed value of the count from MathUtil.doCount retrieved and assigned to this variable. This ensures the script does not hang, if the count takes longer duration to compute.
requests = MathUtil.getCount("LoginFailure","users");

//Always returns true if the number of requests are less than 100.
result = requests < requestsThreshold || failed/requests*100 < failedThreshold;
if (requests > requestsThreshold) {
  ScriptUtil.removeVariable("requestsThreshold");
};
ScriptUtil.removeVariable("reqWinSize");
result;Variables Created
{failed=0.0, failedThreshold=90.0, requests=0.0, requestsThreshold=100.0, result=true, windowSize=150000.0}
Exceptions and Returned Values
result:trueExample 11-2 Directory Outage
The following example counts the log messages for a specified threshold window and can be used to determine if there has been directory outages. The result can further be used to generate a warning on the Health Monitoring in the Admin Server.
This script uses Log functions LogsUtil.recordLogMessage() and LogsUtil.setLogOccurrencesWindow(). It also uses ScriptUtil.removeVariable() function to remove the inrtermediate variable refid. See Help in the evaluator tool for more information about the Log functions.
/*
Directory outages are detected based on LIBOVD-40067 messages that are issued every minute.
*/
//set a reference to the log message when it happens
refid = LogsUtil.recordLogMessage("oracle.ods.virtualization.engine.backend.jndi.adapter1", "LIBOVD-40067");
//set a window size, using the reference id of the log message
windowSize = LogsUtil.getLogOccurrencesWindow(refid);
if (windowSize > 180000.0) {
  LogsUtil.setLogOccurrencesWindow(refid, 180000.0);
  windowSize = LogsUtil.getLogOccurrencesWindow(refid);
};

//count the number of log occurences
count = LogsUtil.getLogOccurrences(refid);
ScriptUtil.removeVariable("refid");
count < 0.5;Variables Created
{count=0.0, windowSize=180000.0}
Exceptions and Returned Values
result:true