11 Monitoring Oracle Access Management Performance and Access Manager Health
Monitoring performance refers to observing (viewing) performance metrics to make yourself aware of the state of specific components of Oracle Access Management. Monitoring health allows perimeter devices to check the health of an Access Manager server instance by hitting the heartbeat URL of the Managed Server.
This chapter contains the following sections on monitoring Oracle Access Management performance and Access Manager health.
-
Monitoring Server Metrics Using Oracle Access Management Console
-
Monitoring SSO Agent Metrics Using Oracle Access Management Console
See Also:
-
Monitoring Performance and Logs with Fusion Middleware Control if you are using Oracle Enterprise Manager Fusion Middleware Control
11.1 Introduction to Performance Monitoring
Component performance metrics can be collected in memory during the completion of particular events. These metrics are kept only in memory so there are several mechanisms to extract and display them including (but not limited to) Oracle Enterprise Manager Fusion Middleware Control (FMW), the Oracle Dynamic Monitoring Service (DMS) and the Oracle Process Manager and Notification Server (OPMN).
-
FMW Control is a Web browser-based, graphical user interface that offers monitoring options. See Monitoring Performance and Logs with Fusion Middleware Control for details.
-
DMS uses the DMS Spy Servlet to provide access to DMS metric data from a web browser. Information is categorized by Noun Types; for Oracle Access Management the prefix is OAMS.OAM_. See Monitoring Metrics Using the DMS Console.
-
dmsdump is provided by DMS to take metrics from the servers based on definitions in a dms configuration file. There are many OAM metrics exposed when dms dumps are generated. See About Dynamic Monitoring Service (DMS) in the Oracle Fusion Middleware Performance and Tuning Guide.
-
OPMN provides access to metrics using dmsdump.
11.2 Monitoring Server Metrics Using Oracle Access Management Console
Users with valid Oracle Access Management Administrator credentials can log into the Oracle Access Management Console and monitor various performance metrics.
This section provides the following topics:
11.2.1 Monitoring Server Instance Performance
Users with valid Oracle Access Management Administrator credentials can monitor performance for Access Manager using the Monitoring command on the Actions menu under the System Configuration tab using the Oracle Access Management Console.
See Understanding the Oracle Access Management Console for details.
Before you begin, the OAM Server must be running.
-
From the Oracle Access Management Console, click Server Instances and the desired server instance.
-
Server Instance:
-
From the Actions menu in the navigation tree, click Monitor Menu.
-
On the Monitor page, click the desired subtab to view results for the server instance:
- Server Processes Overview
- Session Operations
- Server Operations
- WebGates
-
Proceed to Oracle Access Manager Server Metrics
-
-
See also, "OAM Proxy Metrics and Tuning".
11.2.2 Oracle Access Manager Server Metrics
This topic provides a look at the Server metrics available through the Monitor option from the Server Instances tab in the Configuration section of the console.
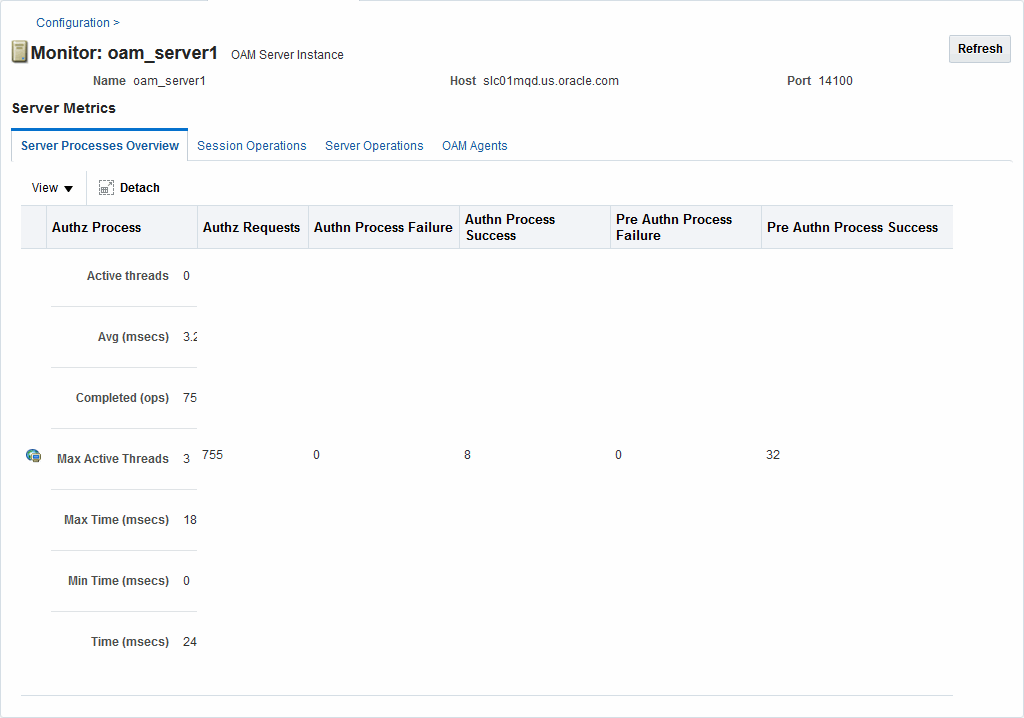
Figure 11-1 shows the Server Processes page.
Figure 11-1 Server Processes Overview Page

Description of "Figure 11-1 Server Processes Overview Page"
Server Processes Overview provides the following OAM Server events, organized in individual columns on the tab.
-
Authorization Process
-
Authorization Requests
-
Authentication Process Failure
-
Authentication Process Success
-
Pre Authentication Process Failure
-
Pre Authentication Process Success
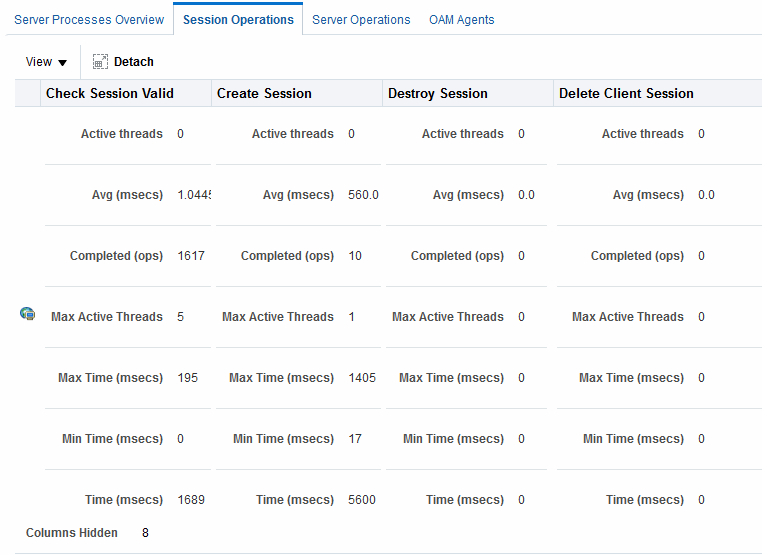
Figure 11-2 shows the Session Operations tab.
Figure 11-2 OAM Server Metrics: Session Operations Monitoring Page

Description of "Figure 11-2 OAM Server Metrics: Session Operations Monitoring Page"
-
Check Session Valid
-
Check Session Valid Failure
-
Check Session Valid Success
-
Create Session
-
Create Session Failure
-
Create Session Success
-
Destroy Session
-
Destroy Session Failure
-
Destroy Session Success
-
Delete Client Session
-
Delete Client Session Failure
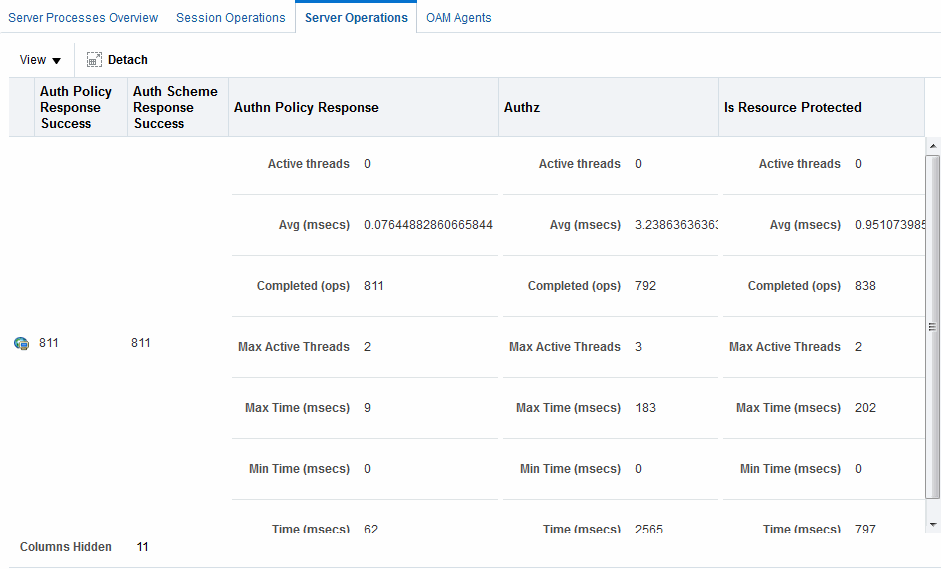
Figure 11-3 shows the Server Operations tab.
Figure 11-3 OAM Server Metrics: Server Operations Tab

Description of "Figure 11-3 OAM Server Metrics: Server Operations Tab"
-
Authentication Policy Response Failure
-
Authentication Policy Response Success
-
Authentication Scheme Response Failure
-
Authentication Scheme Response Success
-
Authentication Failure
-
Authentication Failure Responses
-
Authentication Policy Response
-
Authentication Requests
-
Authentication Scheme Response
-
Authorization Failure
-
Authorization Failure
-
Authorization Process Failure
-
Authorization Process Success
Figure 11-4 shows the OAM Server Metrics: WebGates tab with all available metrics showing.
Figure 11-4 OAM Server Metrics: WebGates Tab

Description of "Figure 11-4 OAM Server Metrics: WebGates Tab"
WebGate performance metrics include:
-
Agent Name
-
Agent Status
-
Version
11.3 Monitoring SSO Agent Metrics Using Oracle Access Management Console
Oracle Access Management Administrators with valid credentials can review metrics for various components and determine whether tuning is needed.
Use the following procedure to display various SSO Agent performance metrics using the Oracle Access Management Console.
Before you begin, the server and agent must be running.
11.3.1 WebGate Metrics
WebGate metrics are organized across various tabs.
The tabs are:
-
Connectivity
-
Operations Overview
-
Operations Detail
-
Information
See Also:
Performance Planning Methodology in the Fusion Middleware Tuning Performance Guide.
Following figures illustrate detached tables for one Webgate with all possible metrics displayed for each:
Figure 11-5 Webgate Metrics: Connectivity Table

Description of "Figure 11-5 Webgate Metrics: Connectivity Table "
Figure 11-6 Webgate Metrics: Operations Overview Table

Description of "Figure 11-6 Webgate Metrics: Operations Overview Table "
Figure 11-7 Webgate Metrics: Operations Detail Table

Description of "Figure 11-7 Webgate Metrics: Operations Detail Table "
Figure 11-8 Webgate Metrics: Detached Information Table

Description of "Figure 11-8 Webgate Metrics: Detached Information Table "
11.4 OAM Proxy Metrics and Tuning
Administrators can tune the performance of OAM proxy through the Java EE container Administration Console.
This section provides the following topics:
See Also:
11.4.1 OAM Proxy Metrics
Throughput refers to the number of requests processed per second. Latency refers to the time required to process a particular request. There is less than a 20% latency increase with the introduction of a proxy between WebGate and OAM Server.
Table 11-1 lists the various OAM Proxy metrics available.
Table 11-1 OAM Proxy Metrics
| Metric | Description |
|---|---|
|
handshakes.active |
Number of active threads doing handshake |
|
handshakes.avg |
Average time spent performing initial handshake |
|
handshakes.completed |
Number of times an initial handshake has been executed |
|
handshakes.maxTime |
Maximum time spent performing initial handshake |
|
handshakes.minTime |
Minimum time spent performing initial handshake |
|
handshakes.time |
Total time spent performing initial handshake |
|
failedHandshakes.count |
Count of failed handshakes |
|
peerCompatibilityFailures.count |
Count of how many Peer Compatibility Check Failures have happened |
|
openSecurityMode.count |
Count of how many Open Security Mode handshakes have happened |
|
simpleSecurityMode.count |
Count of how many Simple Security mode handshakes have happened |
|
SSLSecurityMode.count |
Count of how many SSL Security Mode handshakes have happened |
|
negotiateSecurityMode.active |
Number of active threads doing security mode negotiation |
11.4.2 OAM Proxy Server Tuning Parameters
Performance of the OAM Proxy can be tuned by changing its configuration through the Java EE container Administration Console.
Both the Java EE container Administrator and the Oracle Access Management Administrator can tune performance using the Java EE container Administration Console, which is outside the scope of this book.
Table 11-2 provides the tuning parameters for the OAM Proxy.
Table 11-2 OAM Proxy Tuning Parameters
| Purpose | Parameter | Type | Value | Description |
|---|---|---|---|---|
|
Denial of Service Attacks |
ConnectionValidationInterval |
Integer |
120 |
The time interval in seconds for validating the connections periodically for denial of service attacks |
|
Denial of Service Attacks |
BacklogQueue |
Integer |
50 |
Maximum length of backlog queue |
|
Denial of Service Attacks |
MaxNAPHandShakeTime |
Integer |
100 |
The maximum time in milliseconds within which the client should complete the NAP handshake with client. If NAP handshake over a connection is not completed within this time, the connection will be marked as malicious |
11.5 Monitoring Metrics Using the DMS Console
Oracle Access Management uses the Oracle Dynamic Monitoring Systems (DMS) to measure application-specific performance information for OAM Servers and registered Agents. The metrics can be used to monitor the time spent in a particular area, or track particular occurrences or state changes.
To access the DMS console, type the following URL in a browser window and log in with your Oracle Access Management Administrator credentials.
http:// <example_AdminServer:Port/dms/Spy
Once logged into the DMS console you can monitor metrics as discussed in the following sections.
11.5.1 Monitoring OAM Metrics
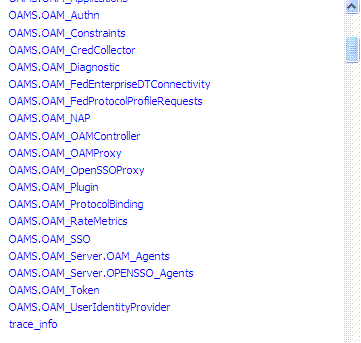
Tthe OAM metrics can be reviewed In the DMS Metric Tables panel.
You can access metrics regarding OAM as illustrated in Figure 11-9. Click the desired metric from those listed to view the results on the right-side of the console.
11.6 Monitoring the Health of an Access Manager Server
Access Manager Services are business critical and must always be available to control user access to an organization's protected web services and applications. Because hardware, network connectivity issues and other failures can happen, HeartBeat monitoring can be leveraged by Load Balancers to ensure user traffic is routed to healthy OAM Servers.
For example, when there is a firewall installed between a User Agent or WebGate and the Access Manager server, perimeter devices can check availability of the Access Manager server (its health) by hitting its HeartBeat URL. The following sections contain details.
11.6.1 Understanding WebGate and Access Manager Communications
The firewall determines this connection is idle after 30-40 minutes of inactivity (depending on its configuration) and terminates the socket connection but does not inform/notify the WebGate or Access Manager server. In this case, when a request for a resource arrives at the WebGate and it sends a OAP message to the Access Manager server, it uses the existing connection and waits for a reply. Because the connection was dropped by the firewall, the WebGate does not receive any reply; so it waits for the TCP timeout. Following the TCP timeout, WebGate understands the message channel is of no use and starts the process to get a new message channel. TCP timeout is OS specific and may vary from several minutes to hours which makes the WebGate unable to process user requests.
Note:
The setKeepAlive WebGate parameter ensures that load balancers do not drop the OAP connection. See Table 15-2 for details.
11.6.2 Monitoring Access Manager Server Health
The OAM monitoring model allows Web Tier components (load balancers) to ping an OAM Managed Server's HeartBeat endpoint at a scheduled interval over HTTP(S). This allows Web Tier components to route incoming HTTP traffic away from unhealthy OAM Managed Server(s).
Every OAM Managed Server exposes this HeartBeat URL:
Scheme://ManagedServerHost:ManagedServerPort/oam/server/HeartBeat
In this URL, the following is true:
-
scheme = https | http
-
ManagedServerHost = Host name of the Access Manager WLS Managed Server
-
ManagedServerPort = Port used by the Access Manager WLS Managed Server
The HeartBeat URL works as follows:
Note:
Neither the health status test results or check results can be communicated in the body of the HTTP Response. A successful heartbeat check will return the HTTP code 200.
