Monitor Processes from the Performance Metrics Service
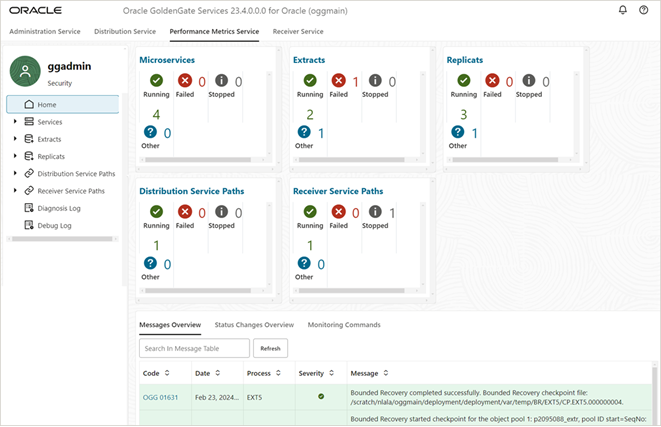
The Performance Metrics Service collects and stores instance deployment performance results. When you arrive at the Performance Metrics Service home page, you see all the Oracle GoldenGate processes in their current state.

You can perform the following tasks on the Performance Metrics home page:
-
Click a process or Microservice to view its performance statistics.
-
To access service messages and status change details from this page, see the following table:
| Tab | Description |
|---|---|
|
Messages Overview |
On the Performance Metrics Service home page, click the Messages Overview tab (if it’s not already selected) to see a drill down into all the service messages. Scroll through the list of messages or search for a specific message by entering the text in the message. |
|
Status Changes |
Real-time status changes to Microservices can be monitored from the Status Changes tab. Status change messages show the date, process name, and its status, which could be running, starting, or stopped. A list of status change messages from the service appears. If you are searching for specific messages, you can use the search but make sure you click Refresh before you search to ensure that you get the updated status for services. |
|
Monitoring Commands |
Click the Monitoring Commands tab to configure the purge datastore options. See Purge Datastore. |
Purge Datastore
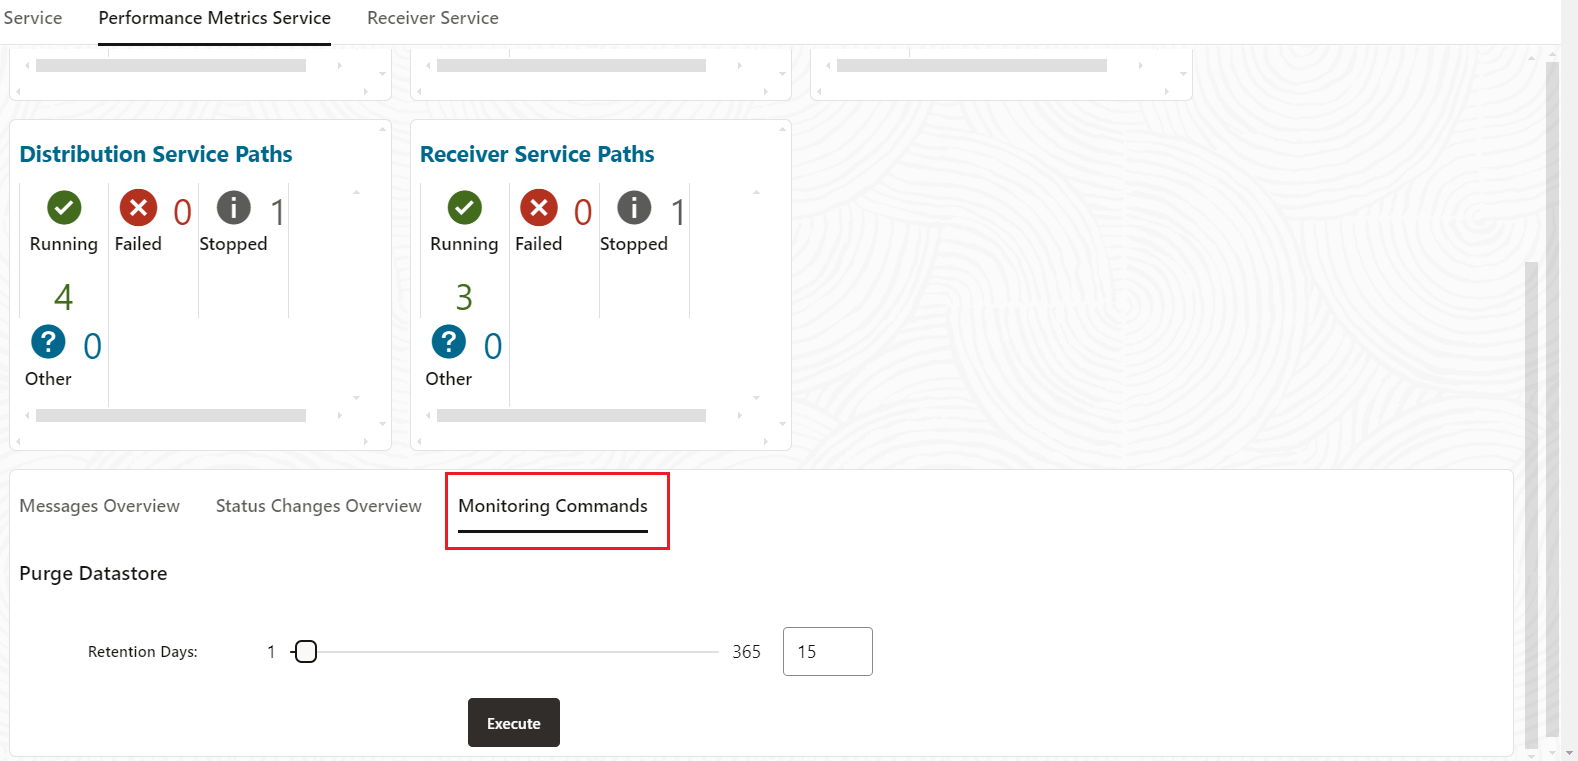
You can change the datastore retention and purge it from the Performance Metrics Service Monitoring Commands tab, as shown in the following image:

Click Performance Metrics Service from the Administration Service web interface, and then click the Monitoring Commands tab to view the current process retention (in days).
You can enter the number of retention days or use the sliding icon to set the new period from 1 to 365 days, then Execute to activate the purge. The details of the purge are also displayed.
Protocols for Performance Monitoring for Different Operating Systems
Oracle GoldenGate uses Unix Domain Sockets (UDS) for UNIX-based and Named Pipes (for Windows) techniques to send monitoring points from Extract, Replicat, and other processes to the Performance Monitoring Service of the deployment.
For each deployment, the Performance Metrics Service is local to the host. This makes it more secure to use the Unix Domain Sockets (UDS) protocol or Named Pipes technique in Windows for Inter-process Communication (IPC) with the service and improve overall performance. Named Pipes utilizes a unique file system called NPFS (Named Pipe filesystem) that allows managing the security as any file subject using security checks for file access.
-
UDS is available with Oracle and non-Oracle databases. The UDS file is located in the
$OGG_HOME/var/tempdirectory of the deployment. -
The standard location for named pipes in Windows is
\\ServerName\pipe\PipeName (\\ServerName\pipe\).
Recover from Datastore Corruption
The Performance Metrics Service collects and manages operational metrics related to the
health and performance of replication processes. The dirbdb directory
stores essential checkpoint information. If contents of this directory are missing or
corrupted, then the Performance Metric Service may not be able to collect performance
data.
To resolve this issue, you can disable the Performance Metrics Service from the Service Manager or the Admin Client, and then enable it again. This will recreate corrupted BDB files and resolve the issue.