Monitor Oracle GoldenGate Processes, Trails, and Paths

Learn about how to monitor Oracle GoldenGate processes, trails, and paths.

Search and Read the Log Information from the Diagnosis Page

Log information allows you to monitor all the messages logged for your Service Manager. This includes processes, trails, paths, microservices, and deployments managed from the Service Manager.

Collective log information for all processes, trails, and paths associated with all deployments and microservices can be accessed from the Diagnosis page in Service Manager. Log information includes details such as the following:

  • Lag information for Extract, Replicat processes, which provides the latency value between the last record processed and its timestamp in the data source

  • Heartbeat table activities from the heartbeat history table. Also see Monitor Lag Using Automatic Heartbeat Tables

  • Status messages for Oracle GoldenGate processes, trails, and paths

  • Error messages for Oracle GoldenGate processes, trails, and paths

  • Status of deployments and microservices

  • Error messages of deployments or microservices

  • Heartbeat

You can perform the following tasks on this page:

  • Sort the Log Information table by column

  • Refresh the log using the Refresh button

  • Search for specific log messages using the search criteria as date, severity, and message

Notice the Notifications tab at the bottom of the page. It displays messages from the service, which are not updated in the log due to transaction errors. For example, failure to log in to the database using the database credentials.

Access the Diagnosis page from the left navigation pane of the Service Manager. The complete log information is displayed on the page.
Search for Log Messages

If you want need to search for a specific message, you can also search for it by following these steps:
  1. Enter a search criteria in the Search box. The search criteria can be Date, or Severity of the message(s), or the Message string itself. You can add multiple search criteria in the search box.
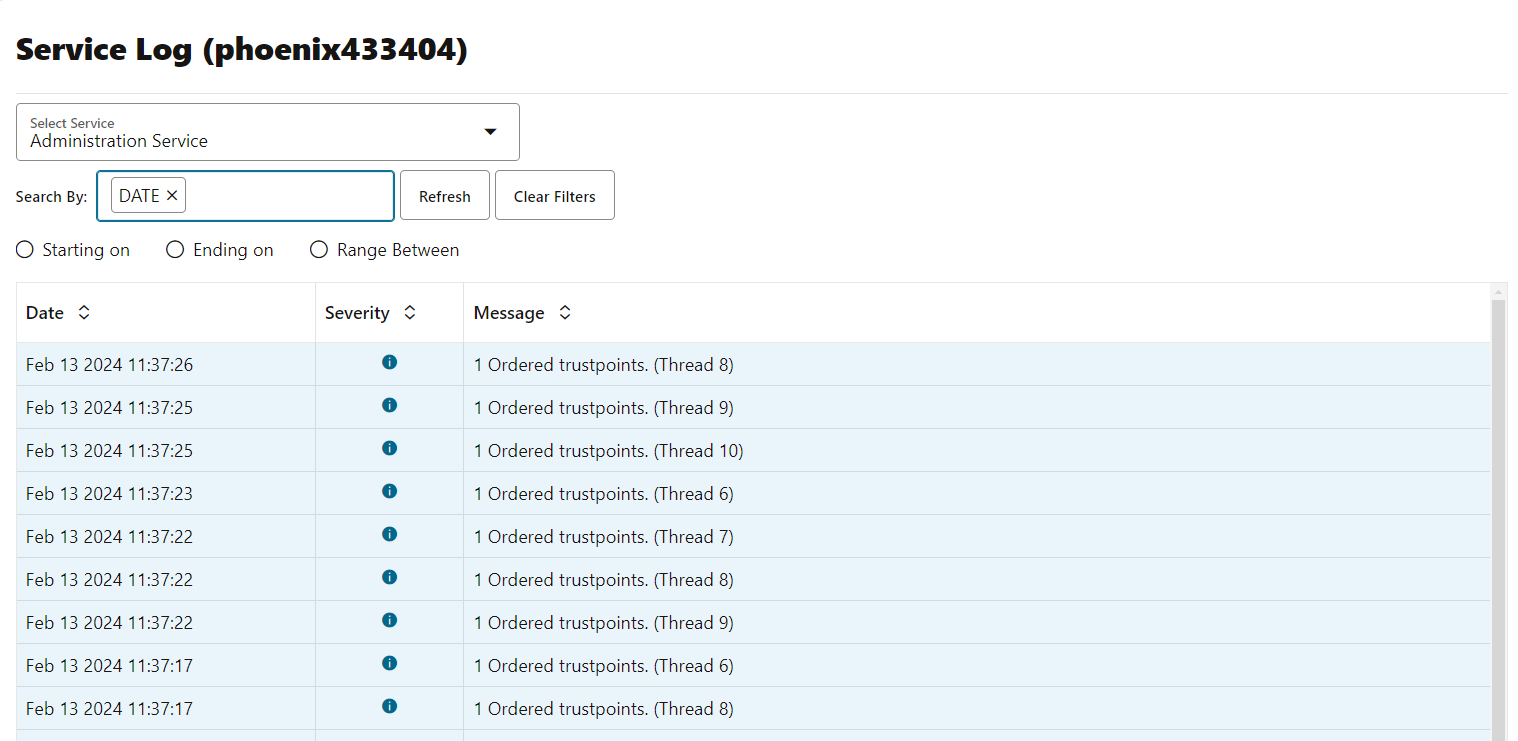
  2. If you select Date, then you get the options:
    • Starting on: Displays the log information from the specified start date.

    • Ending on: Displays the log information till the specified end date.

    • Range between: Displays the log information between the start and end date range.


    Description of log_info.png follows
    Description of the illustration log_info.png

    The screen shows the Date search criteria with the Starting on date.

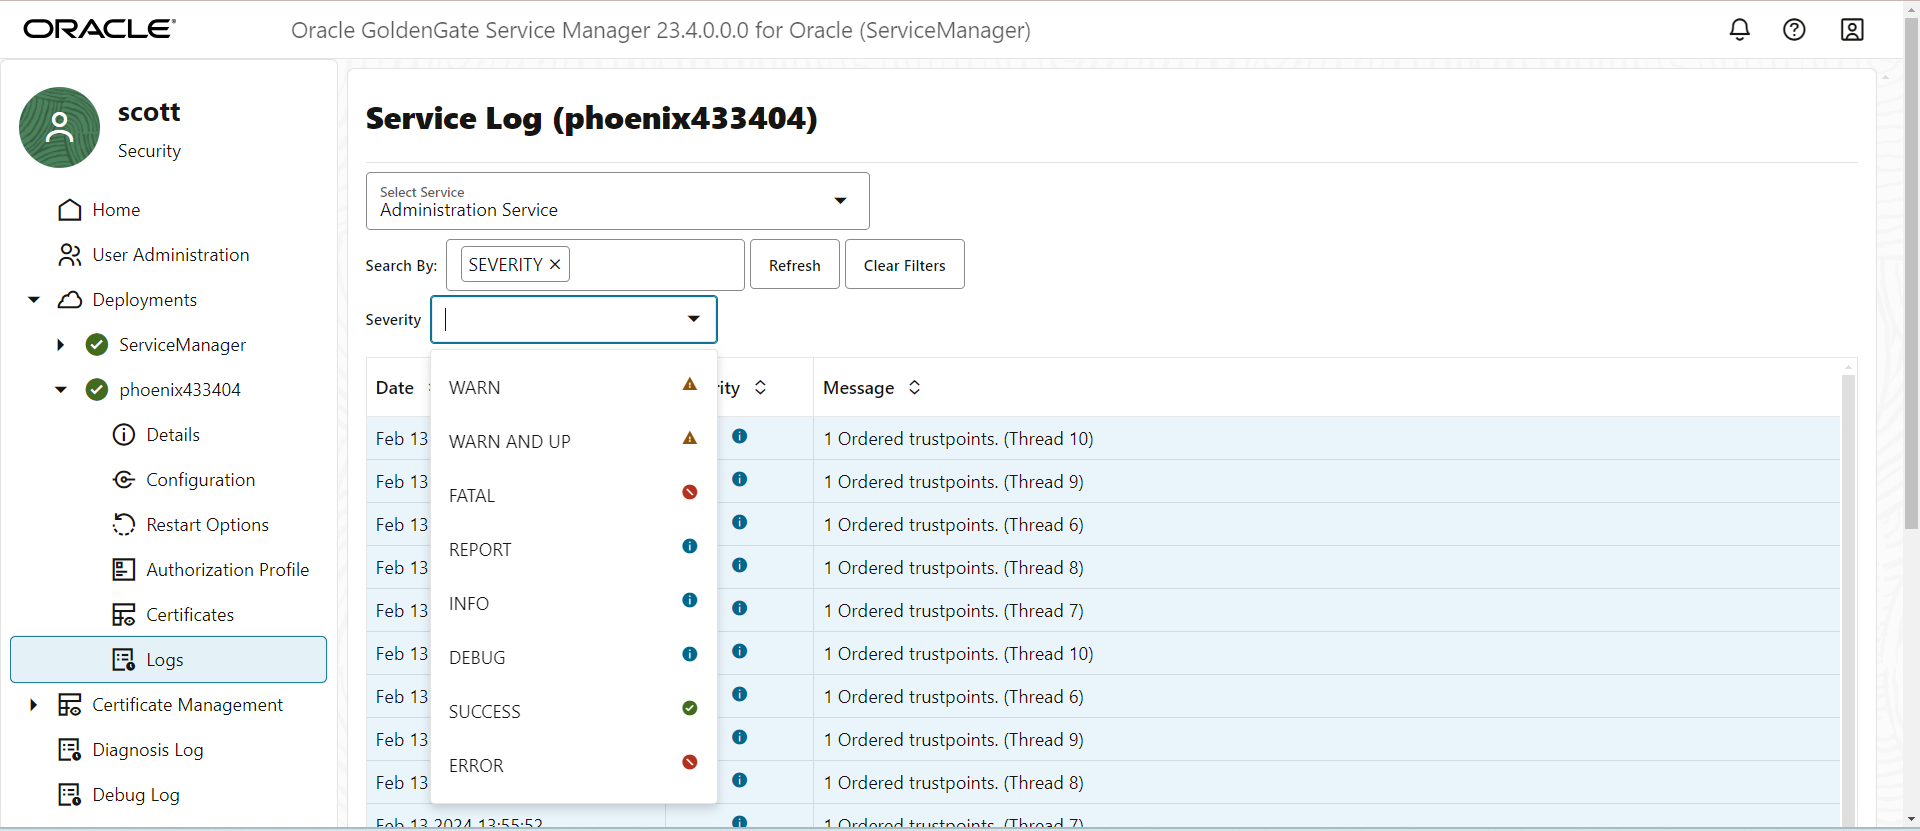
  3. If you select Severity of the message in the log, then you get to choose from the following levels of severity:


    The screen shows various severity levels of messages. You can select any of these severity levels and search for log messages.

    • Warn
    • Fatal
    • Report
    • Info
    • Debug
    • Success
    • Error
  4. Click Clear Filter if you want to delete the search criteria.

Search and Read Log Information for Microservices in a Deployment

You can view and search for log messages associated with one specific microservice in a deployment. This option narrows the log information to display the messages for the selected microservice in the deployment. To access the log information in this manner:
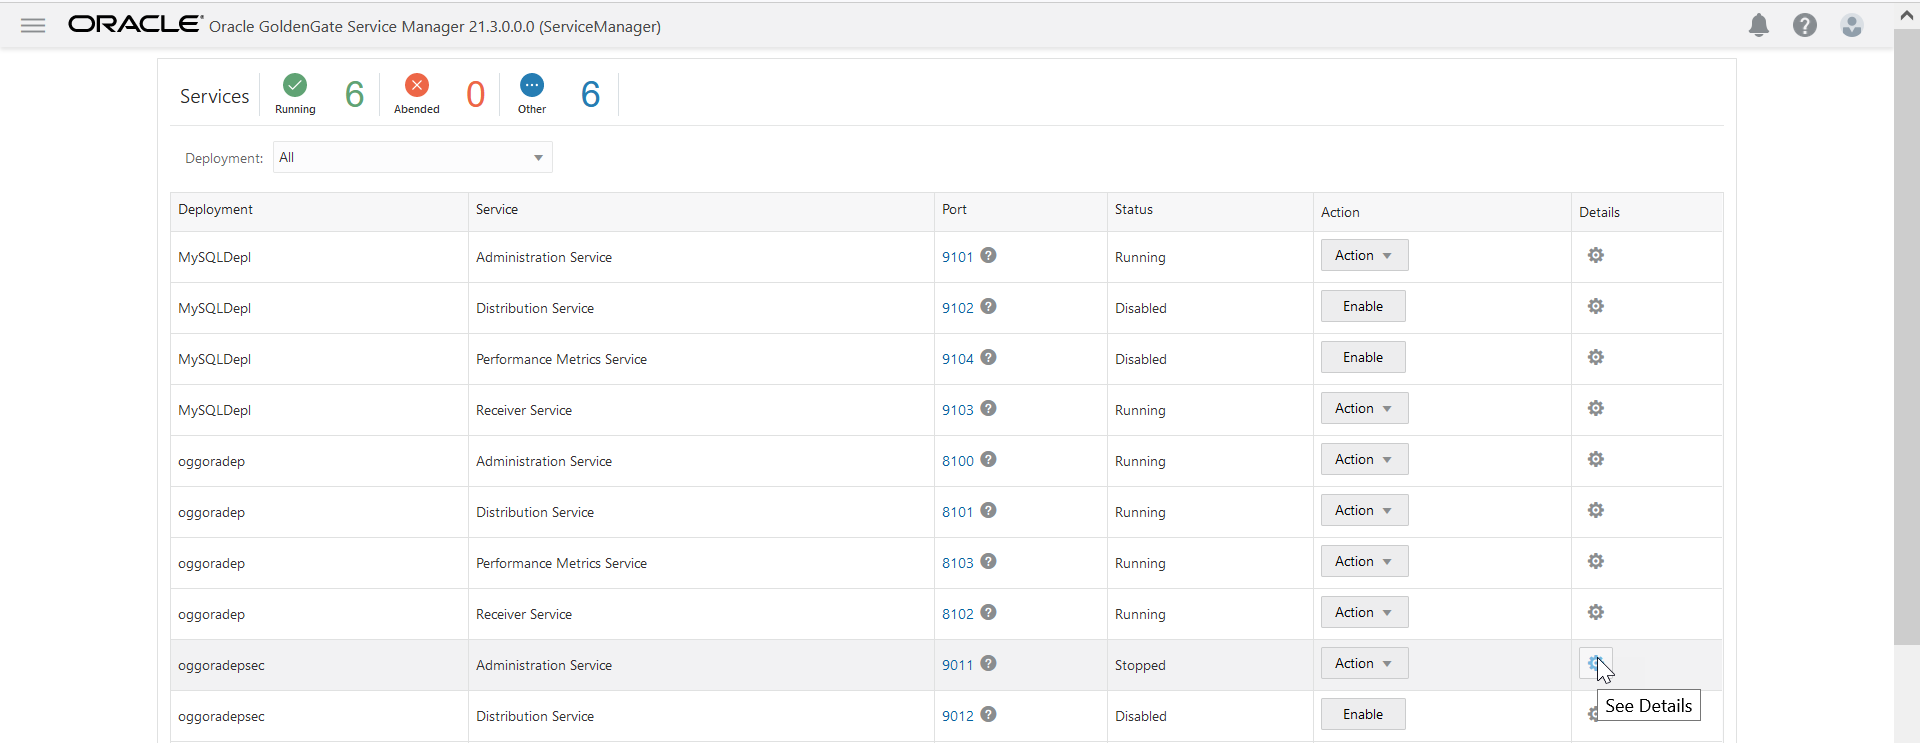
  1. From the Services section of the Service Manager Overview page, click the See Details icon in the Details column.
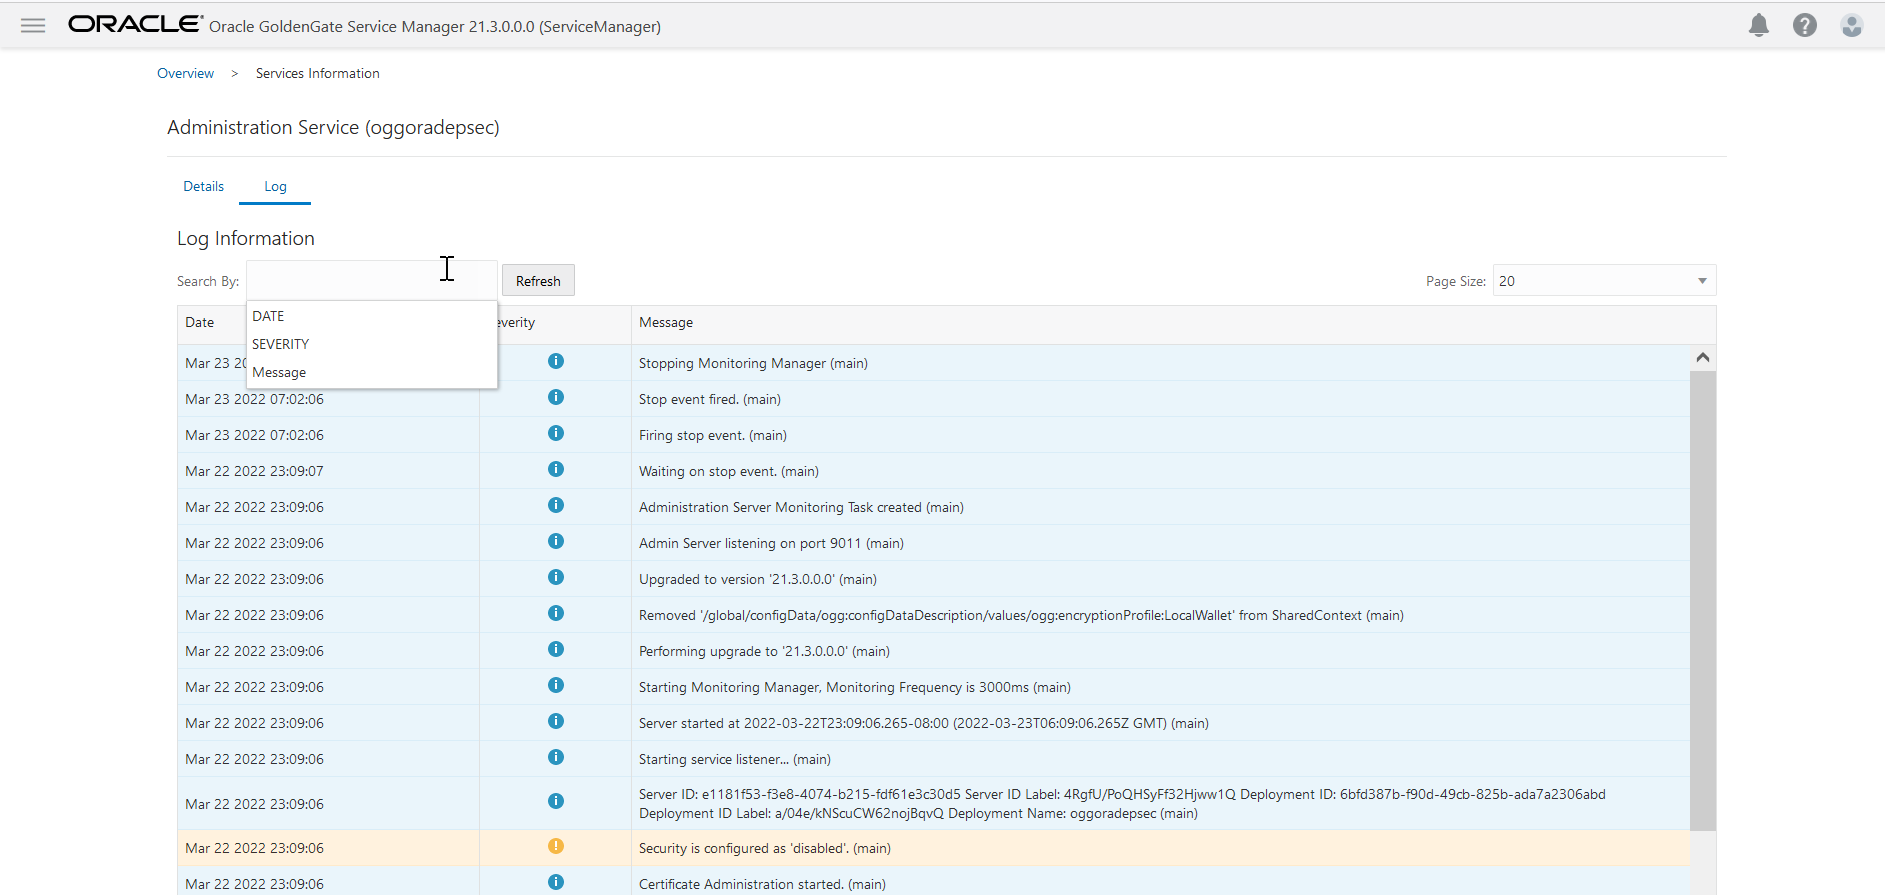
  2. Click the Log tab on the Service Information page. Log information specific to the microservice is displayed on this page.
  3. Select the search criteria in the Search box to view specific log messages.
  4. Enter values for the search criteria as discussed in Search for Log Messages.