6 Running Simulations in Oracle BPM
Use simulations to predict the behavior of business processes under specified conditions, and also to verify that the output meets the metric objectives and identify any bottlenecks. Run simulations to test the effects of changes on an existing process design.
Introduction to Running Simulations in Oracle BPM
Run user-defined simulation in Oracle BPM to determine the efficiency of your processes. Your simulation can reflect either real or anticipated data.
You can:
-
Define multiple models for a given process so that different conditions can be analyzed
-
Run multi-process simulations to learn how working in different business processes can affect shared resources, such as human participants
Simulation Models and Simulation Definitions
Before you run a simulation, you must specify the behavior of each element of your process. To define a simulation you must create and configure the following elements in your BPM Project:
-
Simulation model
Enables you to define the behavior for an individual process model. Note that, for any given process model, you can have multiple simulation models, so that you can mimic a variety of scenarios.
-
Simulation definition
Enables you to define the processes and resources that define a simulation scenario.In a simulation definition you specify the processes that participate in the simulation by selecting the simulation models associated to those processes. A process may have multiple simulation models defined for it. If a process has multiple simulations models defined, then you must select one of those models to use in the simulation definition.
Simulations do not call each individual task within a process. For example, they do not run the service associated to a service task, variables are not assigned values, and external resources are not updated.
However, simulations mimic the behavior of an activity using the following simulation variables that you can define using the Simulation Editor:
-
duration
-
resources
-
cost
-
queue information
-
probability of the instance passing through an outgoing flow
Creating Simulation Models
Simulation models enable you to simulate the behavior of an individual process. They enable you to define how a process behaves as part of a simulation definition.
You can define multiple simulation models for each process, creating different simulations based on different combinations of resource allocation and activity behavior.
You can create the simulation model based on a process using the Simulation Wizard or create from scratch.
How to Create a Simulation Model from a Business Process
To create a simulation model from a business process:
How to Create and Configure a Simulation Model
To create and configure a simulation model:
-
In the Applications window, expand the Simulations node.
-
Right-click the Simulation Models node.
-
Select New and then select From Gallery.
The New Gallery dialog box appears.
-
In the Categories section, expand the BPM Tier node and select the Simulations node.
-
In the Items section, select BPMN Process Model Simulation and click OK.
The Select Process dialog box appears.
-
Select a process.
The Model Simulation dialog box appears.
-
Enter a name for the simulation model.
-
Click OK.
The simulation model appears under the Simulation Models node in the Applications window, and the Simulation Model editor opens.
-
Specify the number of instances to create during the simulation:
-
Select Specify number of process instances to be created.
-
Specify the number of instances to create during the simulation.
Note:
The process simulation runs until the completes the specified duration or reaches the maximum number of instances.
-
-
In the Flow Nodes tree, select an activity.
Depending on which type of activity you select, the following tab pages appear on the right of the Flow Nodes tree:
-
Duration: defines the distribution that determines the time an activity takes to complete.
-
Resources: specifies the number of participants assigned to a particular role. You can define this parameter in the simulation model or at a global project level in the project simulation definition.
-
Cost: specifies the cost of processing the activity. For user tasks it also specifies the cost of the resources assigned to the user task. Measured in salary per hour.
-
Queue Info: defines the simulated behavior of how process instances are queued for a given activity.
-
Outgoing Flows: determines the probability percentage of instances routed through the different outgoing sequence flows.
-
Threads: specifies the number of threads running this flow object. This tab is only available for flow objects that do not involve human interaction.
-
Instance Creation: enables you to specify the distribution curve to use to create instances for the simulation. This tab is only available for start events.
-
-
Configure each activity as follows:
-
In the Duration page, in the Instance Execution Duration section, specify the Distribution Type. Options are listed and described in Table 6-1.
Table 6-1 Options in the Simulation Model Flow Nodes Duration Page
Option Description Constant
Specifies that the simulation model uses the value specifies in the Period property to calculate the completion time for all the activities in the process.
Uniform
Determines the period required to complete an activity consistently, taking into account the variation specified in the delta property. When you select this option, you are prompted to specify each of the following:
-
Mean: Determines the mean time it takes to complete an activity
-
Delta: Defines the upper and lower limit variation of the mean parameter when determining how long it takes to complete a simulated activity
Exponential
Determines how long it takes to complete a simulated activity by specifying how many instances are completed within a specific period. When you select this option, you are prompted to specify:
-
Average Frequency: Determines the average number of instances processed within the interval defined by the Every property
-
Every: Defines the interval used for exponential distribution
Normal
Uses the Gauss Bell distribution to determine how long a simulated activity takes to complete. You must specify the mean and standard distribution. When you select this option, you are prompted to specify:
-
Mean: The mean period required to perform an activity
-
Standard Deviation: The standard deviation of the mean period required to perform an activity
Real
Enables you to specify the amount of time required to complete a simulated activity for a specific time interval. When you select this option, you must specify:
-
Distribution Criteria: determines the time interval for determining how long a simulated activity takes to complete
-
Interval: specifies the period during which the simulation runs.
-
Mean: defines the mean time to complete an activity
-
Standard Deviation: defines the standard deviation of the mean parameter
-
-
In the Cost page, specify the following:
Table 6-2 Properties in the Simulation Model Flow Nodes Cost Page
Property Description Fixed Base Cost
Defines the cost required to perform the simulated activity
Fixed Base Cost Plus Resource Cost
Calculated based on the defined cost per hour and the time it takes the resource to execute the instance. This property is only available for user tasks.
-
In the Queue Info page, in the Queue Warning Size field specify the number of incoming instances that can be waiting for an activity simultaneously.
-
In the Outgoing Flows page, move the slider to specify the probability of each outgoing sequence flow occurring.
If the activity contains boundary events, then the flows of the boundary events appear in this page. For more information about configuring boundary events, see Configuring Boundary Events.
-
Configuring Boundary Events
If the BPMN process you want to simulate contains boundary events, then you must specify the probability of these events happening.
You can specify the probabilities for the different boundary events in the Outgoing Flows page.
The way you specify the probability of a boundary event varies according to the type of the event:
-
Interrupting Boundary Message and Error Events
The probabilities of all the interrupting boundary message and error events for an activity are related. If you add these probabilities the result must always be 1.
The simulation model editor displays a set of sliders to configure these activities. If you move a slider, the values in the other sliders automatically adjust. You can lock the values by clicking the lock icon next to the slider. When you lock a value the simulations model editor does not modify it when you move the other sliders. The simulation model editor forces you to leave at least two values unlocked.
-
Non-Interrupting Boundary Message and Error Events
The probability of a non-interrupting boundary message or error event is independent from the probability of other events happening. This value of this probability can vary between 0 and 1.
The simulation model editor displays a slider for each non-interrupting boundary message or error event. You can move this slider to specify any value between 0 and 1.
-
Timer Events
To specify the probability of a boundary timer event, you must define the time interval between occurrences of the event. If the implementation of the timer event in the BPMN process uses an expression, then you must define a fixed time interval to use during the simulation. If the implementation of the timer event in the BPMN processes uses a fixed time interval, then redefining the time interval is optional because you can use the interval defined in the BPMN process for the simulation.
The simulation model editor displays a table for interrupting timer events and another one for non-interrupting timer events. You can redefine the time intervals for each of the events using these tables.
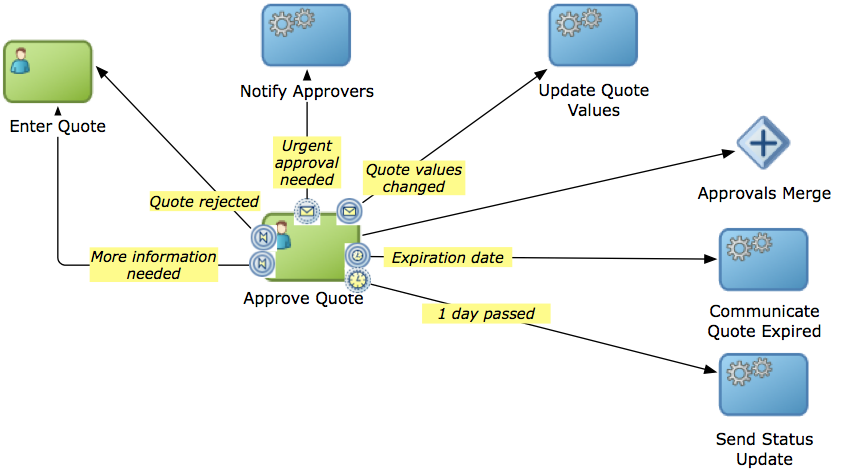
Figure 6-1 shows the Approve Quote user task with different types of boundary events. Figure 6-2 shows the simulation configuration page for the Approve Quote user task.
Figure 6-1 The Approve Quote user task with multiple boundary events
Description of "Figure 6-1 The Approve Quote user task with multiple boundary events"
Figure 6-2 Outgoing Flows tab page for the Approve Quote task
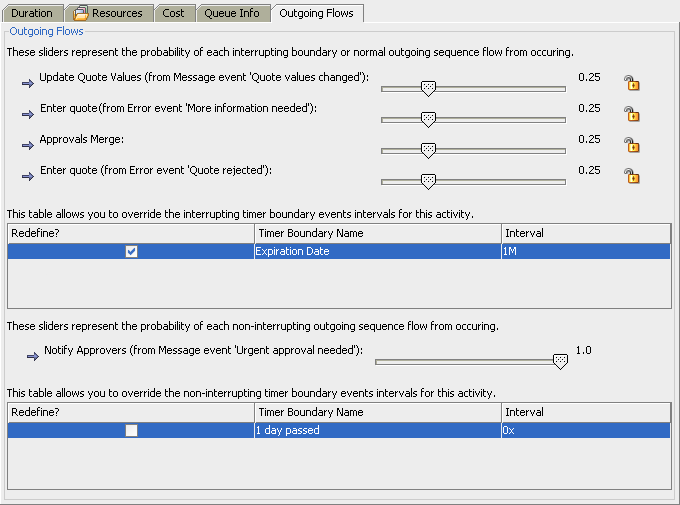
Description of "Figure 6-2 Outgoing Flows tab page for the Approve Quote task"
Creating Simulation Definitions
You can create a simulation definition to represent a simulation scenario for a group of simulation models. You can select which simulations model to run from the group of simulation model contained in the simulation definition.
You can also create a simulation definition after you create a simulation model using the Simulation Wizard. For more information on how to create a simulation model and a simulation definition using the Simulation Wizard, see How to Create a Simulation Model from a Business Process.
How to Create a Simulation Definition
In a simulation definition, you can customize the following parameters to see how they influence the performance of your project:
-
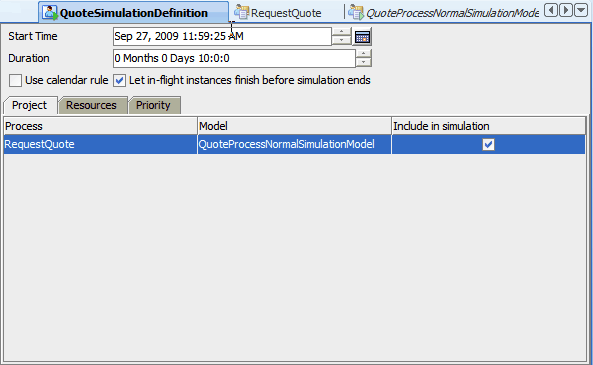
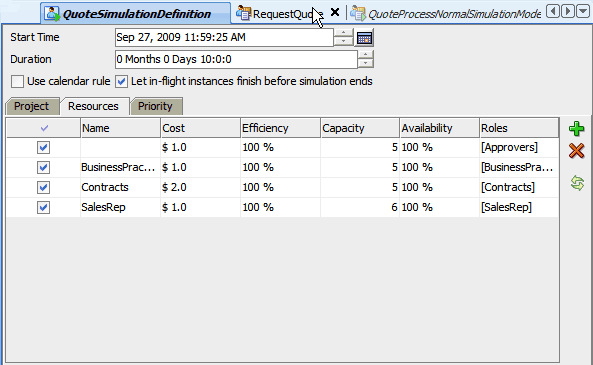
Start time and duration of the simulation
-
Which process simulation models you want to include in the project simulationThe participant resources you want to include in the simulation
To create and configure a simulation definition:
Running Simulations
When you run a simulation, the animation appears in the project editor.
You can pause, stop, or run a simulation to the end. If you stop the simulation, you must restart it from the beginning.
How to Run a Simulation
To run a simulation, you must have created simulation models and at least one simulation definition.
To run a simulation:
-
In the Applications window:
-
Open the Simulation view.
-
From the Simulation list, select the simulation definition you want to run.
-
Click Run Simulation.
The simulation begins.
-
What Happens When You Run a Simulation
The animation of the simulation appears in the project editor, and the results appear according to your specifications in the Simulation page.
Note:
If you place the mouse pointer over a column in the chart, a tooltip with the value of the activity or indicator appears.
Understanding the Simulation View
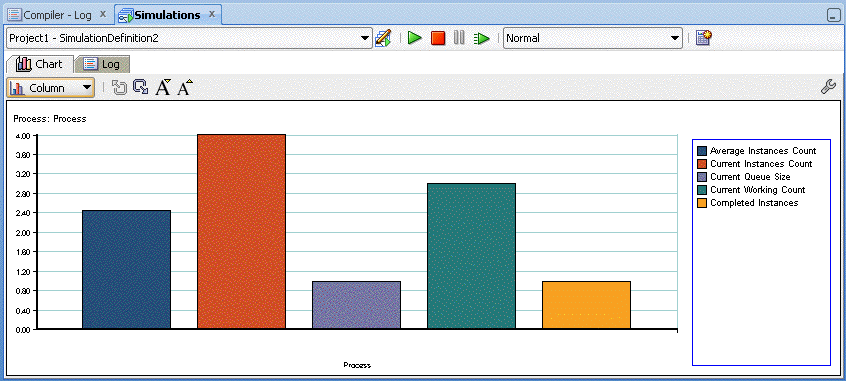
The simulation view enables you to configure and run a simulation. Figure 6-5 shows a simulation view.
The toolbar on the Simulations view enables you to:
-
Select which simulation to run from the Simulation list.
-
Start, stop, and pause the simulation, or run it to the end by clicking the appropriate button. If you choose to run the simulation to the end, the simulation runs in the background with no animation making the simulation faster.
Note:
If you stop a simulation, you must restart it from the beginning.
-
Select the speed at which to run the simulation from the Speed list. In normal speed, instances are created at rate of one per second.
The toolbar on the Chart tab enables you to:
-
Change the type of graphic to display the results
-
Drill up and drill down
-
Decrease and increase the font size
Analyzing the Results of a Simulation
You can display simulation results either as a chart or as a log file by clicking either the Chart tab or the Log tab in the Simulations window.
The Log tab displays a log that tracks the movements of all the instances in the simulated process. Each line in the log contains the following information:
-
Date and Time
-
Process
-
Instance
-
Instance path
How to Analyze the Results of a Simulation Using a Chart
The Chart tab enables you to select a type of chart to display the result of the simulation. You can configure this chart to display the resources to monitor. You can also select the units the chart uses to measure the resources use.
In the Chart tab you can configure how to display the chart with the results of the simulation by configuring the following:
-
Type of chart
-
Activities or resources to monitor
-
Indicators
Figure 6-6 shows the toolbar for a sample Chart page.
To analyze the results of the simulation using a chart:
How to Generate a Simulation Report
You can generate a simulation report that contains the result of the simulation.
To generate a simulation report:
What Happens when You Generate a Simulation Report
Oracle BPM Studio creates a directory using the name and location you selected. This directory contains an HTML file for each of the processes in the simulation.
The HTML file contains:
-
a graphic that displays the result of the simulation
-
a link to a CSV file with the simulation data
-
a link to a CSV file with the simulation resources data
You can view the CSV files with the simulation data and resources data in a spreadsheet application.
