Use Geometry Data Type Columns in Visualizations
Oracle Analytics supports the geometry data type which lets users visualize and work with geometry columns and layers in visualizations.
Topics:
Content authors can use the geometry data type in their workbooks.
About the Geometry Data Type
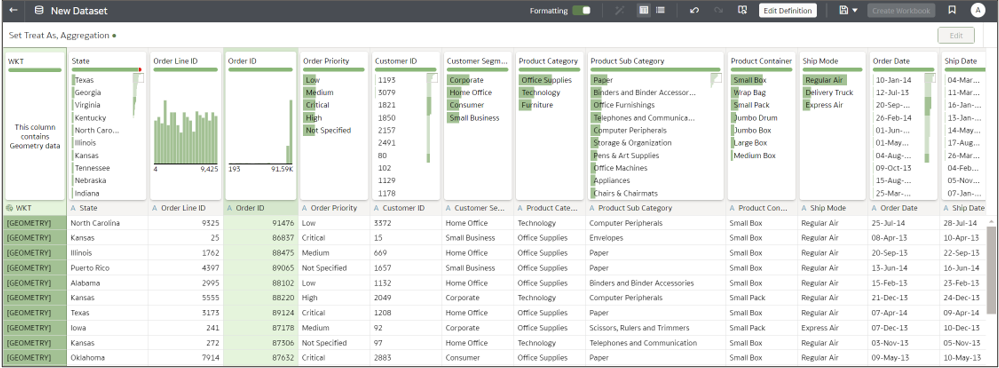
Oracle Analytics automatically recognizes geometry columns from Oracle databases and CSV files, so you can easily import and connect to spatial data.
A geometry data type in Oracle Analytics can represent a wide range of spatial shapes, including points, polygons, and lines, enabling detailed and dynamic geographic visualizations. You can use Geometry data types for visualizing data on maps or as inputs for advanced spatial calculations, enabling detailed spatial analysis.
Geometry columns are special first-class objects in Oracle Analytics that you can use for the following operations:
- To create map visualizations
- In custom calculations for spatial measurements and correlations (either on a canvas or in a data flow)
- As part of custom SQL sourcing (meaning that you can create a dataset using Spatial SQL defined through the Manual SQL query mode)
When you use a geometry column many other operations are disabled or extremely limited. You can't use geometry columns as filters in a workbook or as components (visualization definition grammar) in any visualizations other than maps. You can’t set the geometry data type manually on a data column, it must be recognized as a geometry data type when importing as a dataset.
About the Business Value of the Geometry Data Type
You can easily use Geometry columns from Oracle databases and CSV files, so that you can easily import and connect to spatial data.
Accelerate Map Design and Visualization
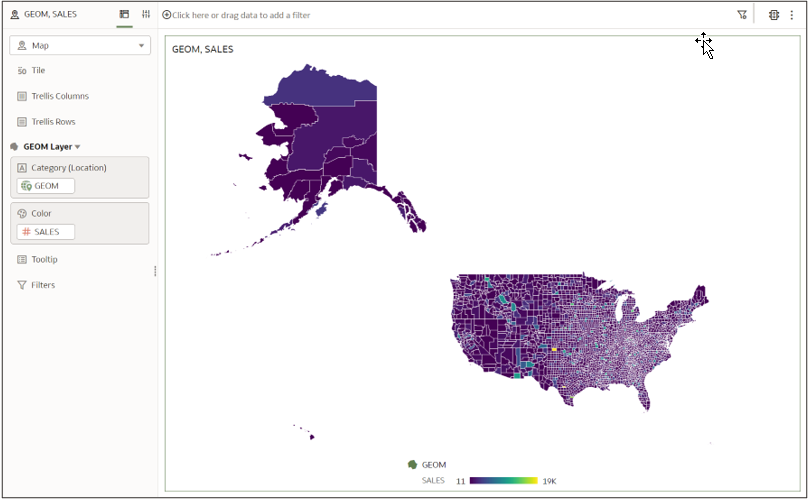
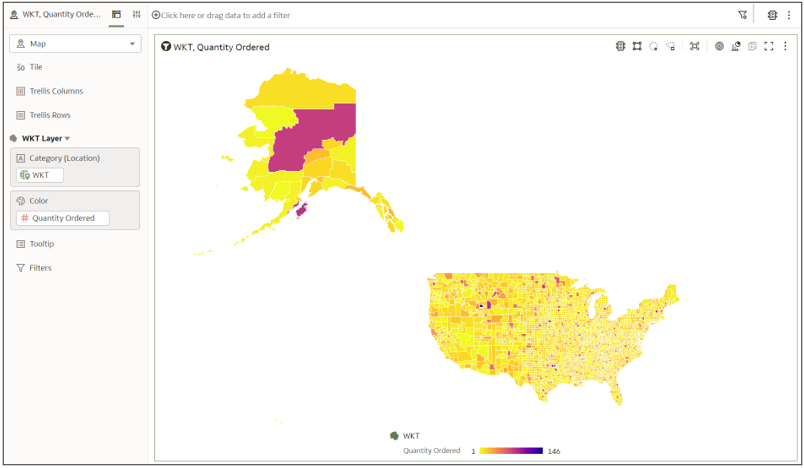
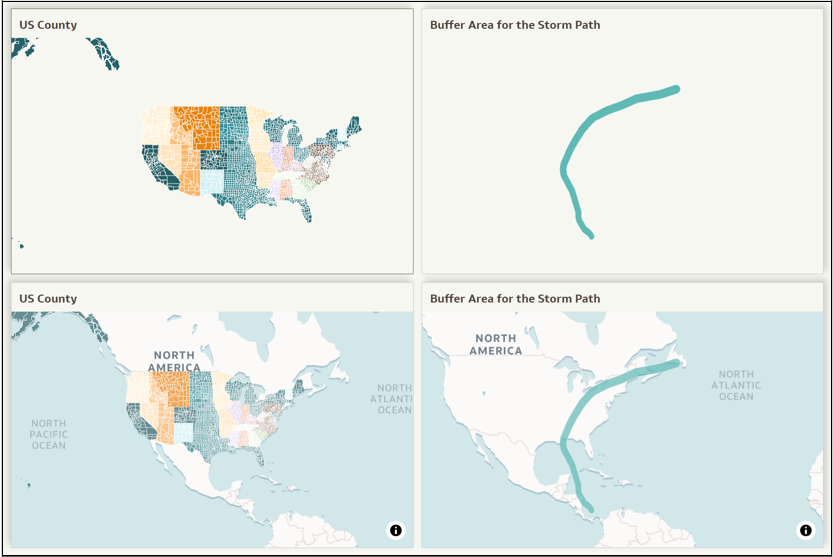
You can quickly visualize geographic information by dragging and dropping geometry columns onto a canvas where the shapes render automatically as a map visualization, without having to manually set up any map layers. Spatial data objects, whether sourced directly from an Oracle database or a CSV file, are effortlessly rendered in Oracle Analytics as maps, allowing you to quickly create dynamic spatial insights. This native feature boosts visual performance and ensures the smooth and responsive rendering of spatial data objects.
Optimize Map Layer Maintenance
In scenarios where geometry definitions frequently change—such as delivery routes, flood zones, or custom sales regions—using the geometry data type ensures that maps in Oracle Analytics are automatically updated with the latest shape information. There’s no need to preconfigure or ensure a specific map layer exists in your Oracle Analytics environment, the geometry data automatically shows in a map visualization. There’s also no need to manually update any data or map layers to reflect changes, as the maps dynamically adjust by querying the updated geometry data. This eliminates extra maintenance of data layers or map layers and ensures that maps always display the most current data.
Support Spatial Calculations
You can compute calculations to perform spatial measurements using the geometry data type. Spatial calculations enable you to calculate the area and length of geometry shapes, measure distances between two geographic data types (assuming proper joining is defined), determine spatial relationships, and perform condition-based calculations that return true or false. These calculations help you analyze geographic data more effectively, leading to powerful spatial data-driven decisions.
Work with Geometry Data Type Columns
Oracle Analytics supports the geometry data type which lets users visualize and work with geometry columns.
Topics:
Content authors can use the geometry data type in their workbooks.
Prepare Geometry Columns for Visualizing Maps
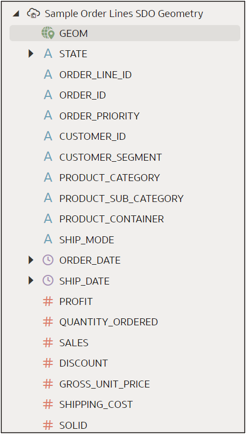
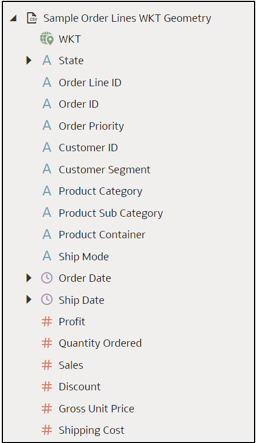
You can prepare and connect to geometry data types in Oracle Analytics from either an Oracle database, using the Spatial Data Object Geometry data type (SDO.Geometry), or a CSV file.
Add Geometry Columns to a Workbook
You can start visualizing shapes from a geometry column by using a dataset that holds geometry data.
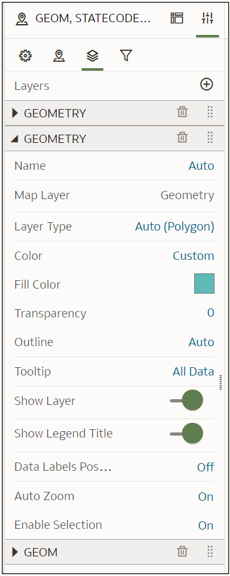
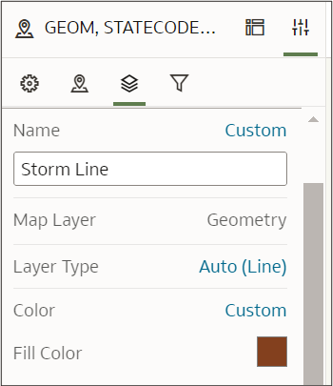
Work with Geometry Data Layers and Layer Properties
You can make changes to geometry data layers and layer properties.
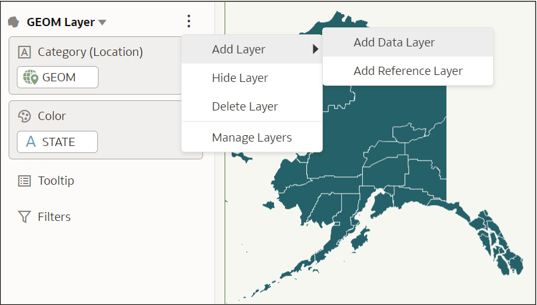
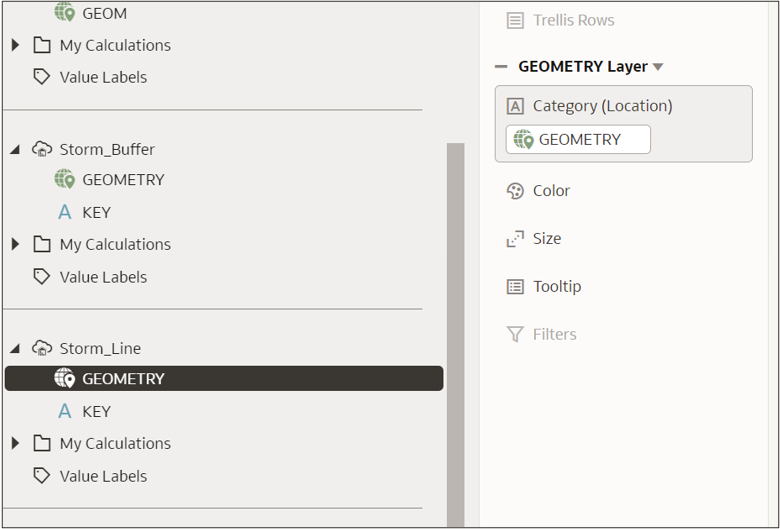
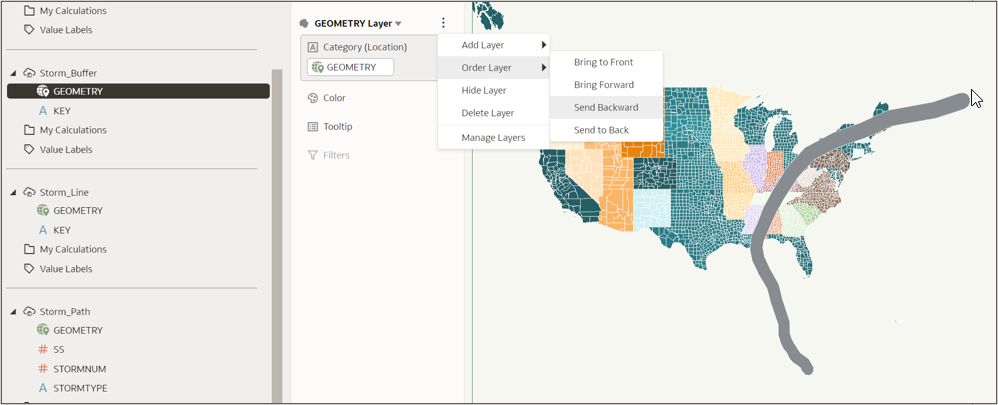
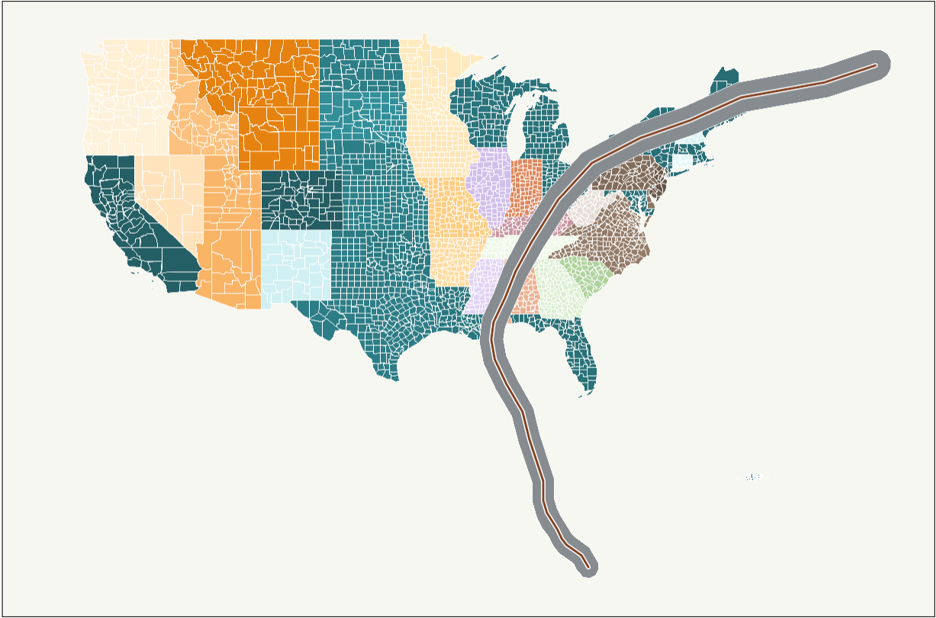
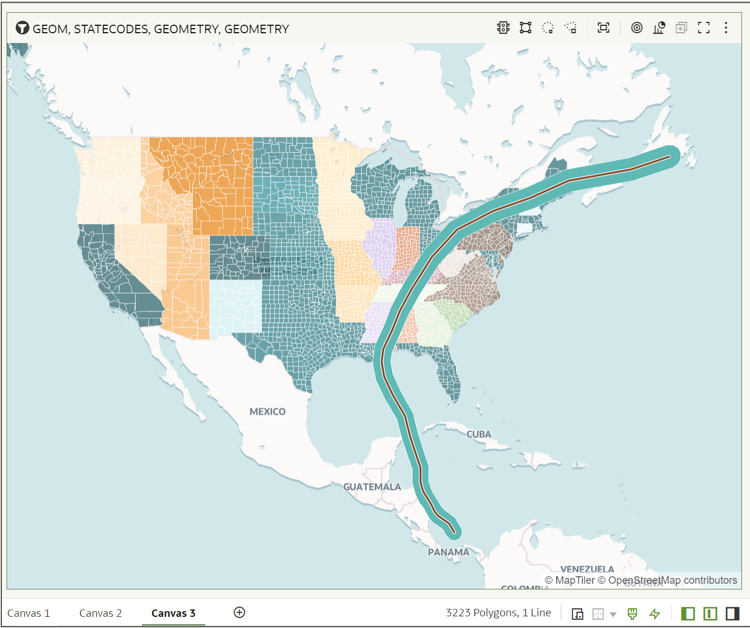
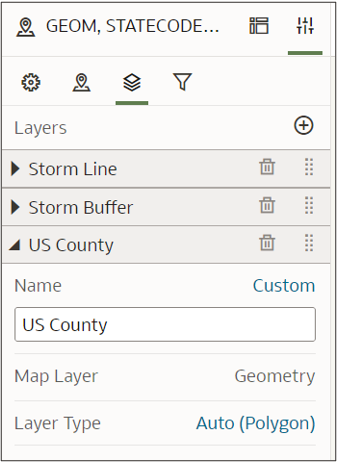
Overlay Multiple Data Layers with Geometry Columns
You can add geometry columns to multiple data layers.
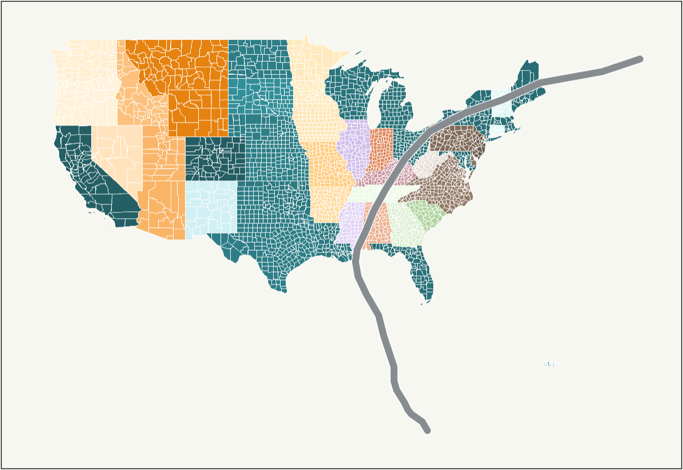
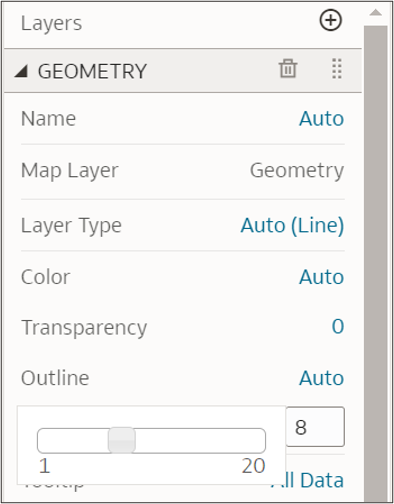
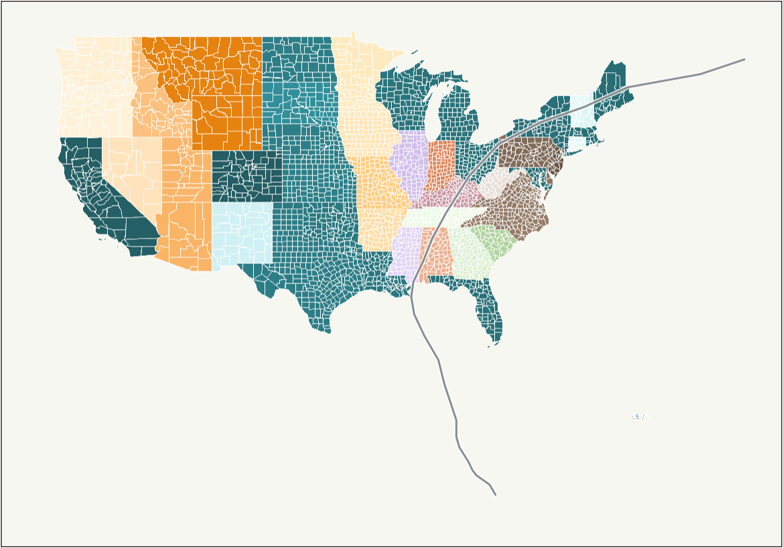
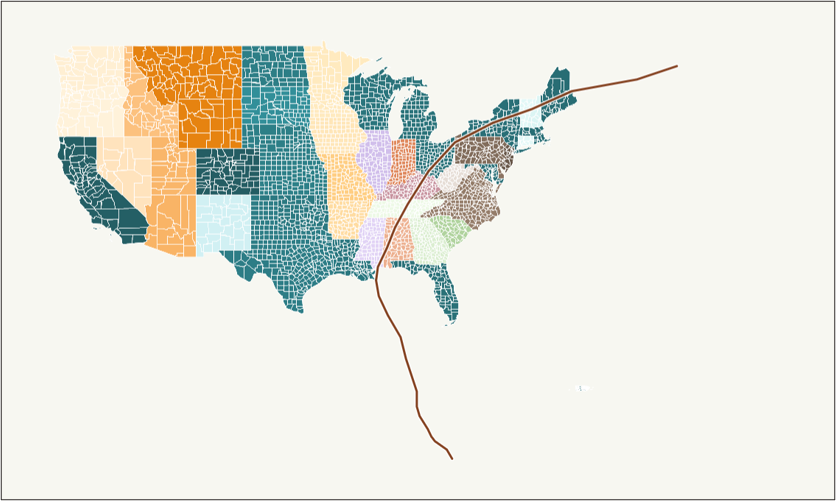
Adjust the Size of a Geometry Data Layer
If your geometry data layer is a line or a point you can adjust the size of the data layer.
Work with Background Map Layers and Geometry Data Type Layer Properties
You can make changes to background map layers and geometry layer properties.
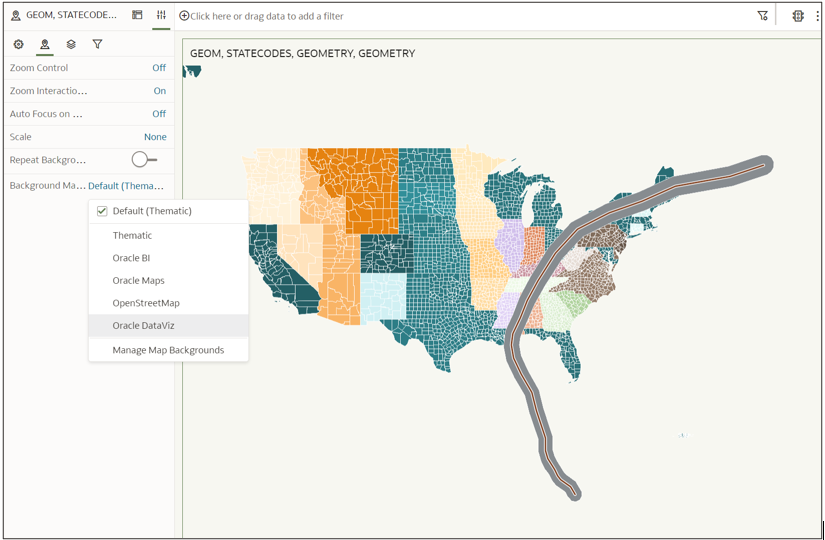
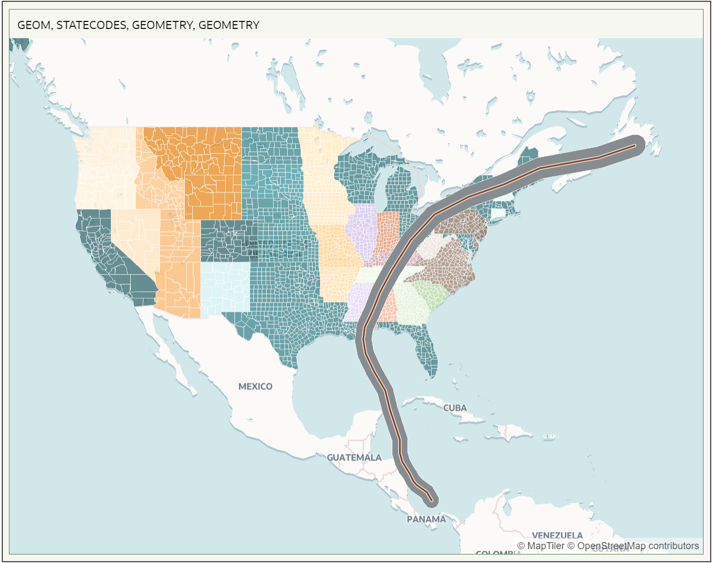
Apply a New Background Map Layer for Geometry Data Type Layers
You can apply a new background map layer for all of the geometry data type layers.
Work with Toggle Off, Toggle On, and Legends for Geometry Data Type Layers
You can toggle the geometry type data layers on and off when the map legend is enabled.
Work with the Selection Tool for Geometry Data Type Layers
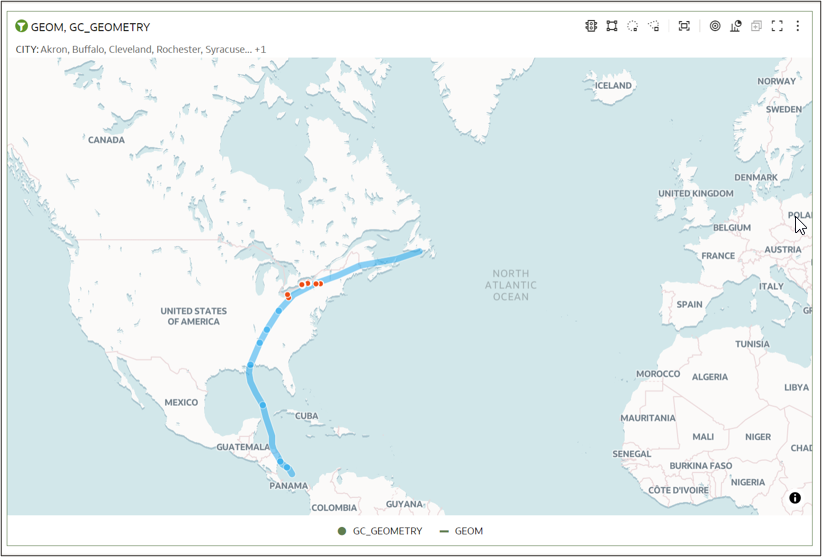
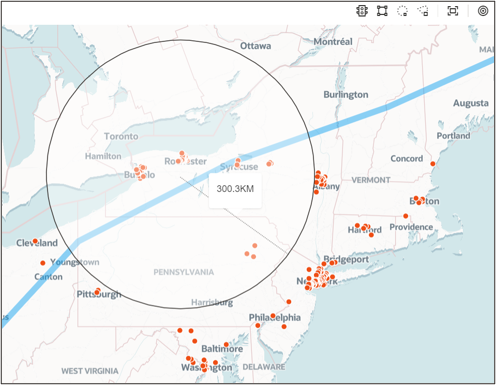
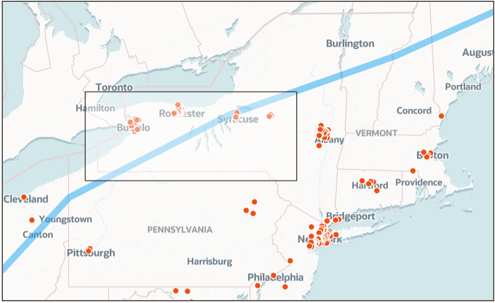
You can use the Selection tool to interact with geometry data type map layers.
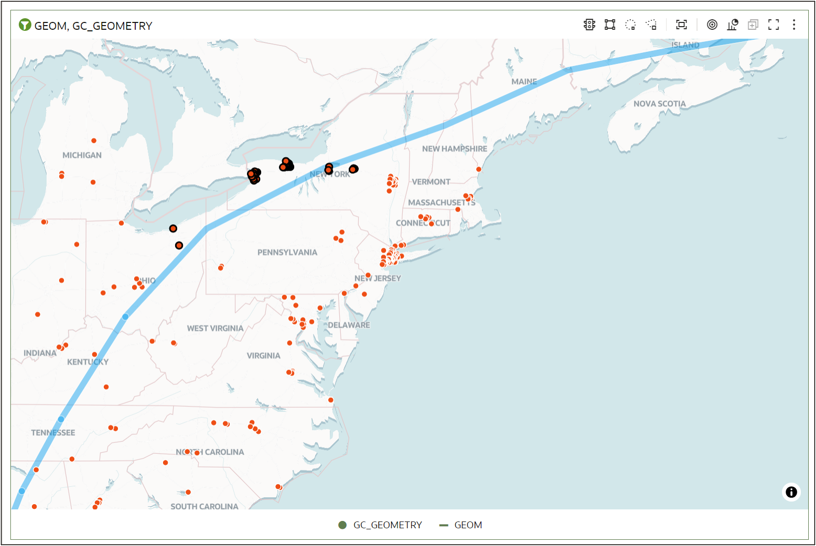
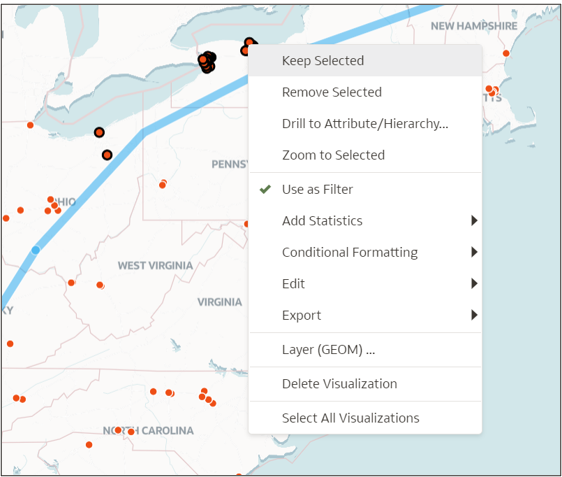
You can only select content based on geometry columns if an attribute ID column (for example the name of the shape, or its ID), is added to the map visualization. For example, the Keep Selected and Remove Selected options are only available once an attribute is added as a Color, Tooltip, or Shape.
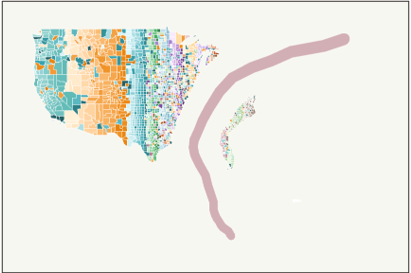
This example shows the Storm Line layer and a layer with assets in
different cities. City as an attribute column is used as a tooltip here to enable
the Keep Selected and Remove Selected options.
Description of the illustration maps_geodatatype_layer_keepremove_selected.png
Work with the Information Option for Geometry Data Type
You can use the Information option with a map visualization tool to get information about geometry shapes that may not be displayed on the map.
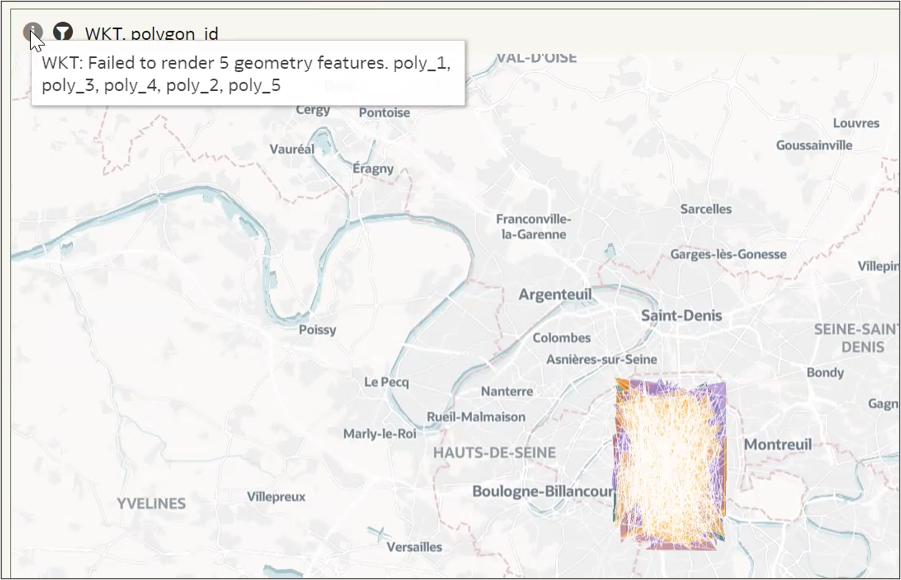
For example, shapes or polygons that are greater in size than 128 KB (per record) aren’t displayed in the map visualization. In this case, the Information icon (![]() ) appears toward the bottom right of the map visualization. When you click the icon, its color changes from grey to green (
) appears toward the bottom right of the map visualization. When you click the icon, its color changes from grey to green (![]() ) and turns on the Information option near the map visualization title. When you hover over this option, you can see which shapes don't render as part of the layer. The information displayed is more detailed if the attribute ID column is part of the map visualization (as a tooltip, color, or shape).
) and turns on the Information option near the map visualization title. When you hover over this option, you can see which shapes don't render as part of the layer. The information displayed is more detailed if the attribute ID column is part of the map visualization (as a tooltip, color, or shape).
This example shows how the Information option provides more information on shapes that have issues, or that didn’t render.
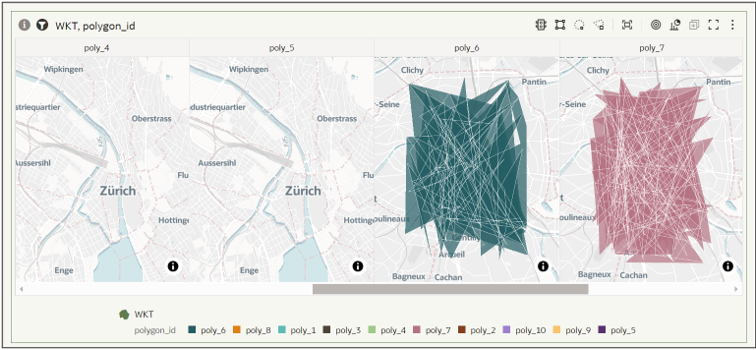
In this example the polygons are shown in a Trellis Column, and polygons poly_4 and poly_5 aren’t displayed due to shape size beyond 128 KB, whereas poly_6 and poly_7 are displayed since the shape size is within 128 KB.
About Calculations that Require Only One Geometry Column
You can create calculations that use only one geometry column.
Calculate the Area of a Geometry
You can calculate the area of a geometry using one column.
Use the function GeometryArea() to calculate the area that a shape occupies.
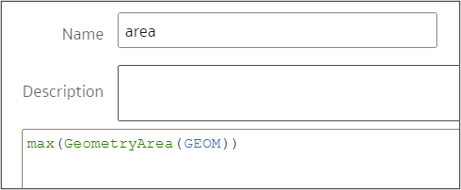
This example shows an aggregate function max() applied on the GeometryArea() calculation.
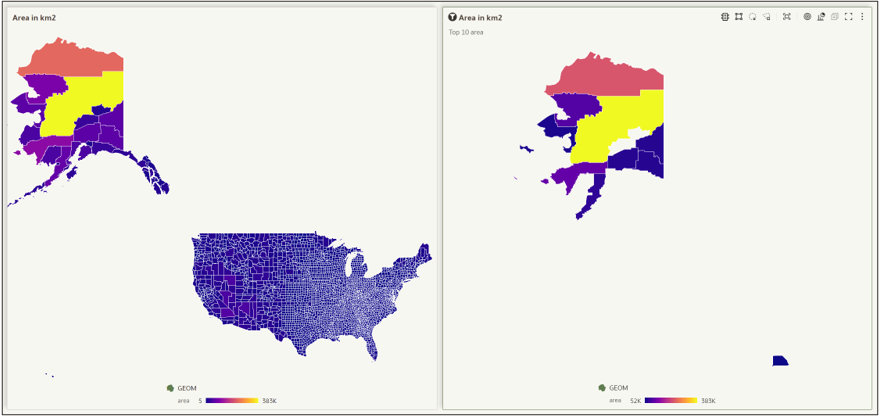
This example shows how Top 10 counties in US based on area is visualized alongside all counties colored by the calculated area.
Calculate the Length of a Geometry
You can calculate the length of a geometry using one column.
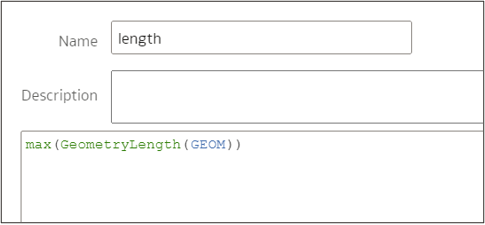
Use the function GeometryLength() to calculate the length that a shape occupies.
This example shows the aggregate function max() applied to the GeometryLength() calculation.
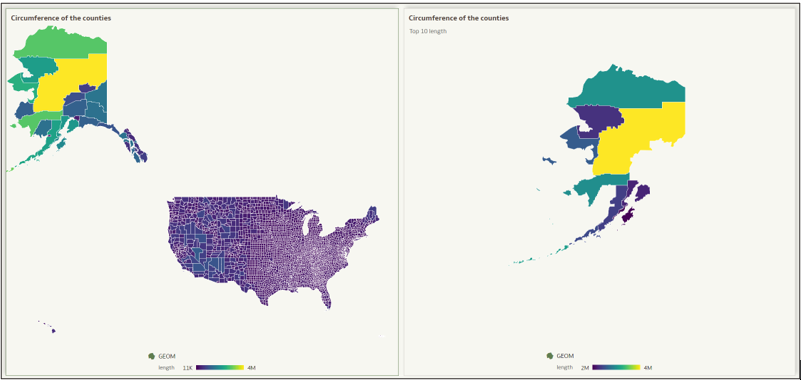
This example shows the visualization on the right selecting top 10 counties based on GeometryLength() alongside all counties colored by length of the shape.
Generate a Spatial Data Object Definition in Standard Text Format
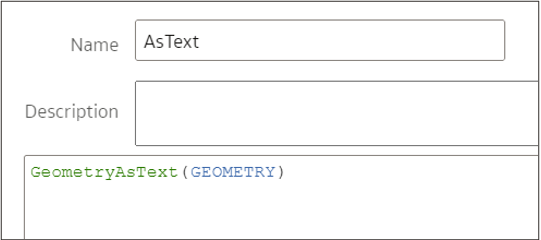
You can use the function GeometryAsText() to convert the longvarbinary values of the geometry column into Well-Known Text (WKT) format.
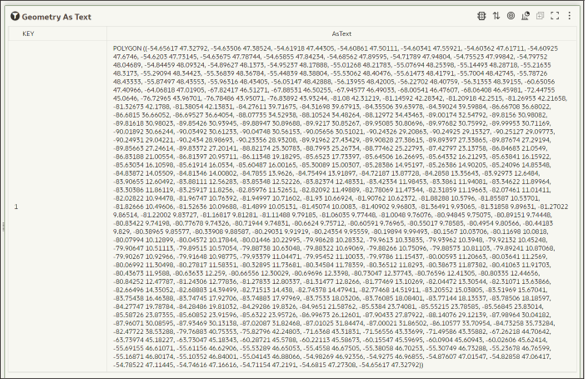
The function GeometryAsText() is also useful to troubleshoot when a specific shape isn’t being represented in the visualization.
This example shows the usage of GeometryAsText().
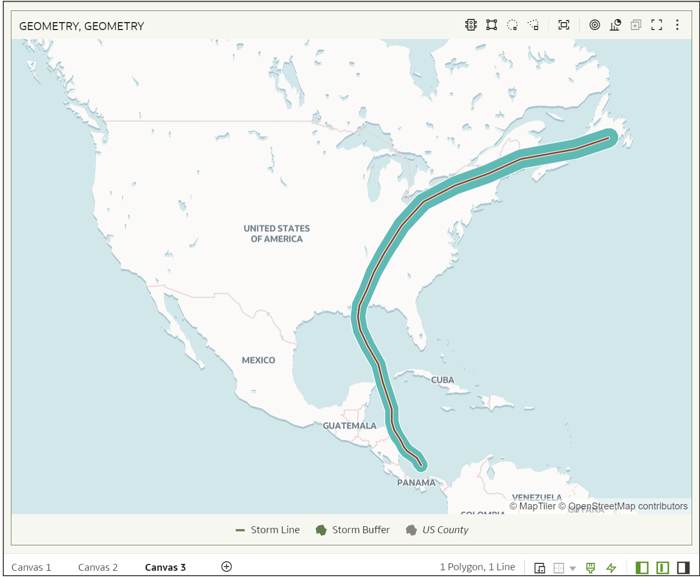
This example shows the standard format of the Storm Buffer geometry column.
You can also use standard calculation functions along with GeometryAsText(). For example, you can use the string function Length() to calculate the size of a shape, which is useful when identifying if a shape is beyond the acceptable limit of 128 kilobytes.
Usage: Length(GeometryAsText(Geometry_Column)) returns
the size of the geometry shape in bytes.
About Calculations that Require Two Geometry Columns
You can create calculations that use two geometry columns.
Calculate the Distance Between Two Geometry Data Types
You can use the function GeometryDistance() to calculate the distance between two shapes.
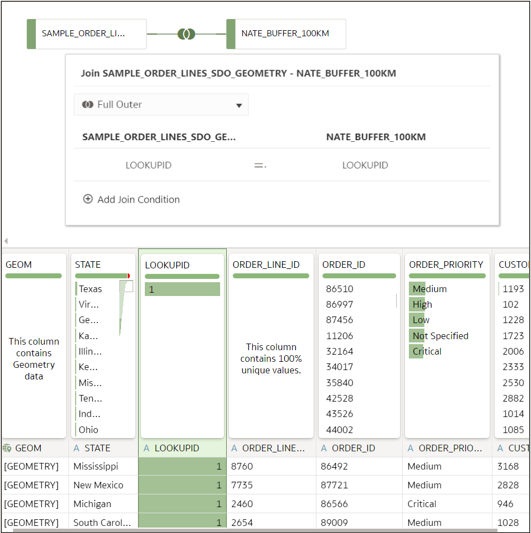
If your data holds two geometry columns in different datasets, then this function requires you to properly join the two datasets so that all geometry records inter-relate (mimicking a spatial join). It’s advisable to establish the join while you prepare and create the dataset, and avoid blending the columns within the workbook canvas as an ad hoc mashup. It’s critical that you always consume these joins with some filter value on one side of the join. Either design the dataset with an embedded filter value, or design the canvas with an explicit filter value when using these in advanced geometry calculations. A good practice is to always filter the values while using calculations like GeometryDistance, GeometryRelate, and GeometryWithinDistance.
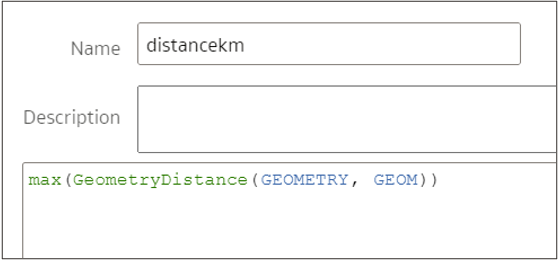
Usage: GeometryDistance(geometry_column1,geometry_column2).
This example shows an aggregate function max() applied on the GeometryDistance() calculation.
This example shows a join defined between two different database tables when you create the dataset.
Relate Two Geometry Data Types
You can use the function GeometryRelate() to determine whether one shape is related to another shape.
A shape from one geometry column can be inside, outside, adjacent inside, adjacent outside, or touching another shape from a different geometry column. The shapes are categorized as Inside, Outside, or Touch. This function may require a Cartesian join.
Usage:
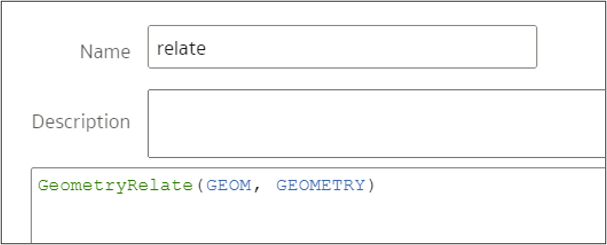
GeometryRelate(geometry_column1,geometry_column2).
This example shows the usage of the GeometryRelate() calculation.
The sequence in which the geometry columns are selected within the GeometryRelate() calculation has a direct impact on the result in which shapes are identified as relating to each other.
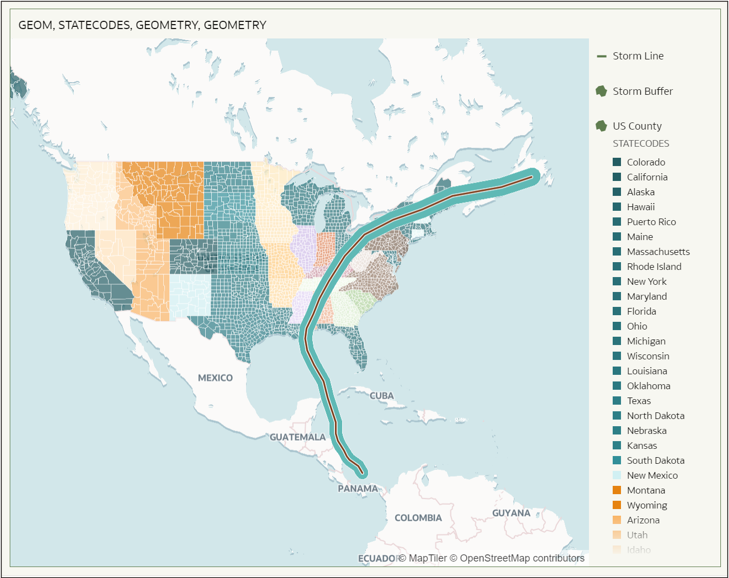
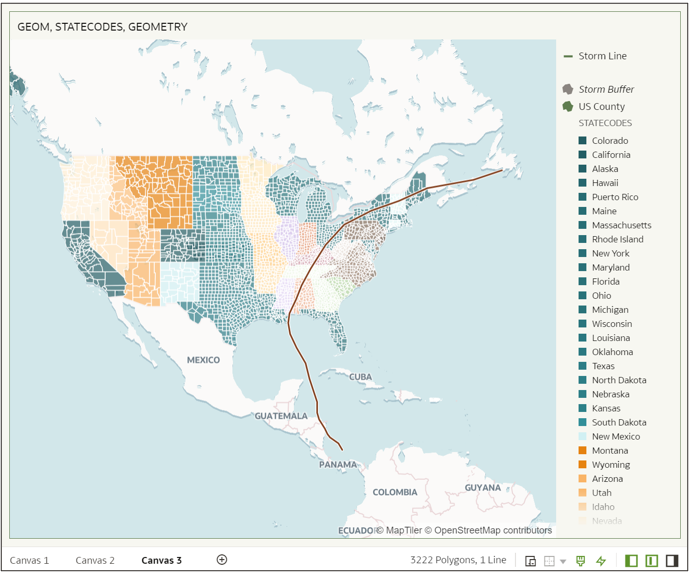
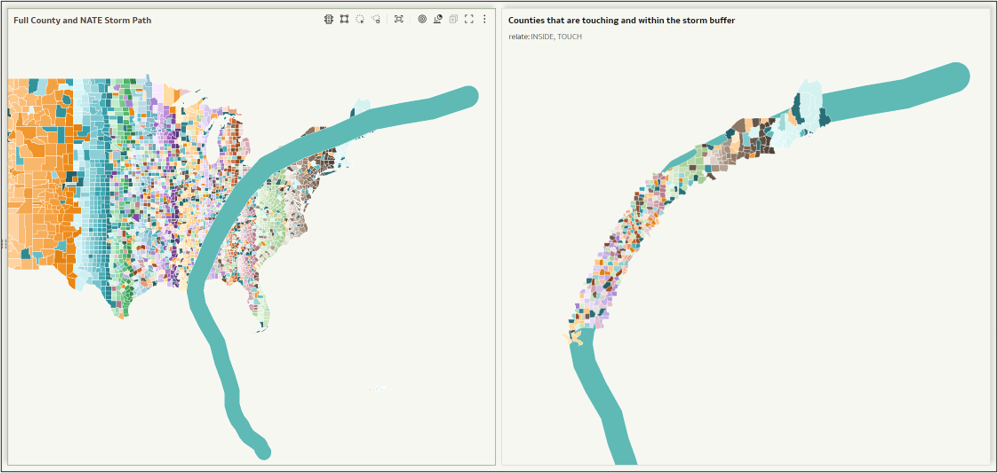
This example shows the visualization on the right relating all the counties that are touching the storm buffer or inside the storm buffer for potential impact.
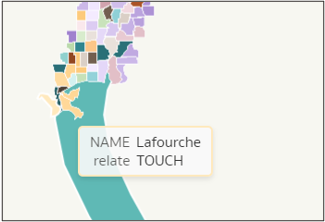
This example shows shapes from US counties that are touching the storm buffer shape, calculated using the GeometryRelate() calculation.
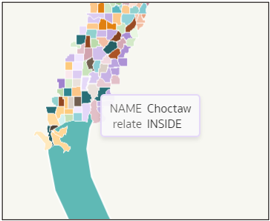
This example shows shapes from US counties that are inside the storm buffer shape, calculated using the GeometryRelate() calculation.
Determine if Two Geometry Data Types Are Within a Specific Distance
You can use the function GeometryWithinDistance() to determine whether two shapes are within a specified distance of each other.
Based on the calculation, this function returns a True or a False as the result, and you can design visualizations based on the result. This function may require a Cartesian join. The sequence in which the geometry columns are selected within the calculation has a direct impact to the result.
Usage:
GeometryWithinDistance(geometry_column1,geometry_column2,distance_in_meter).
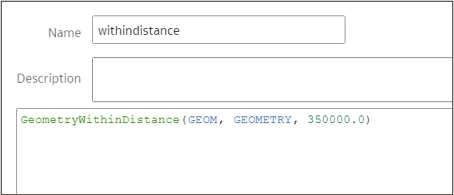
This example shows the usage of the GeometryWithinDistance () calculation with two geometry columns within a numerical value of 350,000 meters or 350 kilometers.
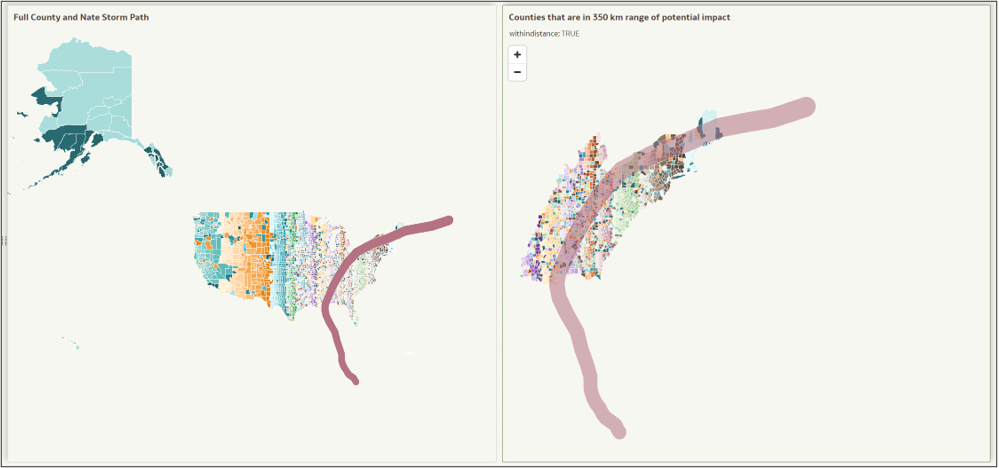
This example shows the visualization on the right with all US Counties within a 350 kilometer range of the storm buffer. Only those counties that return the result as True are filtered and shown.
This example shows all the US Counties that return False and hence don’t have any direct impact from the storm.
What Are the Limitations of the Geometry Data Type?
The geometry data type offers exciting possibilities for map-based visualizations and advanced spatial analysis. While there are some limitations to the geometry data type, understanding them helps you make the most of its capabilities.
Limitations with the geometry data type columns:
- Geometry columns can't be:
- Used as joins between database tables
- Used as objects to drill on
- Dragged into any Filter grammar field
- Used to pass context in a custom data action
- Clicked to filter a selection of shapes
- Rendered in maps on mobile devices
- Used in advanced analytics functions like Forecasting, Clustering, Outlier/Non-Outlier, Reference Line, and Trend Line
- Geometry columns:
- Can only be placed in the Category grammar field for a map visualization. The content of a geometry column is only valid when used in a map or as an argument for a spatial calculation
- Are only valid when used in a map, or as an argument for a spatial calculation
- Geometry data have limitations for use in data flows.
- Spatial joins or joins between geometry data types from different database tables or datasets aren’t supported.
- Geometry data type records must each be under 128 kilobytes. If a record
in a data source has a geometry expression where the size is above 128 kilobytes,
the projection for this record doesn’t show on a map.
- For example, suppose a table contains data about US states. The table has 50 rows, each containing a geometry data type column with the polygon representing the state shape. Assume one of the states has a very high resolution for its border definition, and the size of the geometry object string for this state amounts to more than 128 kilobytes. Now suppose Oracle Analytics creates the dataset, and queries made to the dataset honor every single column from the dataset. If geometries are projected on a map, then only 49 states are shown on the map. The state that's larger than 128 kilobytes isn't shown on the map, and a warning displays in the dialog for the Information icon on the map.
If the size of a geometry shape is over 128 kilobytes, then you can try these alternative workarounds:
- Simplify the definition of the polygon (reduce the number of points to delimit the polygon), and therefore reduce its technical storage.
- Split the polygon into two or more distinct polygons to break down the size of each piece.
- For example, suppose a table contains data about US states. The table has 50 rows, each containing a geometry data type column with the polygon representing the state shape. Assume one of the states has a very high resolution for its border definition, and the size of the geometry object string for this state amounts to more than 128 kilobytes. Now suppose Oracle Analytics creates the dataset, and queries made to the dataset honor every single column from the dataset. If geometries are projected on a map, then only 49 states are shown on the map. The state that's larger than 128 kilobytes isn't shown on the map, and a warning displays in the dialog for the Information icon on the map.
- Oracle Analytics supports 2-D map coordinate systems only. Any known coordinate system defined in the data source is projected to WGS 84 (EPSG 4326).
- File-based data sources containing geometry data must be Text/CSV files with the Geometry field expressed as Well-Known Text (WKT) formats. WKT is a text markup language for representing vector geometry objects. It can represent distinct geometry objects such as Points, MultiPoints, LineString, Polygons, and MultiPolygons. WKT format syntaxes such as GeometryCollection or FeatureCollection aren’t supported.
- Files with the GeoJSON format with geometry data aren’t supported for importing as datasets with geometries in Oracle Analytics. In order to create a dataset with a geometry column, you must first convert GeoJSON files into CSV with WKT geometry formats, or load them into an Oracle database with the SDO.Geometry format.
What Are the Performance Considerations for the Geometry Data Type?
The geometry data type has some performance considerations that you should understand to help you make the most of its capabilities.
You should consider the following performance considerations for the Geometry data type:
- Physical size of the data retrieved by the map
- For large datasets with many distinct geometry records, the performance when rendering a map visualization might be impacted by the size of the geometry data that transits over the network to the browser in which Oracle Analytics is running. The performance is a combination of how many distinct geometries are represented on the map, and the average size (in kilobytes) of each geometry. As the map visualization builds, it fetches the geometry definitions through the network for each distinct shape on the map, and for each distinct layer. Very large lists of geometries take longer to render when geometries have a very fine definition (large average size).
- Mitigation Avoid using too many geometries in a map. Even if the system supports up to 125,000 geometries, using too many can cause the map to render slowly. If you do need to show many shapes at once, filter specific areas so that users can display one area at a time.
- Spatial Cartesian joins
- Spatial calculation functions such as GeometryDistance, GeometryRelate, and GeometryWithinDistance, may require you to have two joined datasets. These functions might require a many to many join type in order to compute every pair of geometries in your data. You must design this modelling with care to minimise the impact on query performance.
- Mitigation
- Use a data model, and most importantly, data filtering on geometry records to avoid Cartesian joining effects.
- When using a database, spatial calculations ship down the function to the database and let Oracle Analytics retrieve the results of the calculation. When you optimize performance, try to ensure this function-shipping is happening properly. There may be cases where other calculations are added (in data flows or workbooks) that prevent Oracle Analytics from pushing down the work to the database. In the context of troubleshooting performance, it’s important to check the context that allows function shipping.
List of Oracle Spatial Calculations
You can use this list of spatial functions from the Oracle Analytics Calculation Library when you work with the geometry data type.
| Spacial Function | Syntax | Description |
|---|---|---|
| GeometryArea | GeometryArea(shape_expr) | Calculates the area that a shape occupies. |
| GeometryLength | GeometryLength(shape_expr) | Calculates the circumference of a shape. |
| GeometryAsText | GeometryAsText(shape_expr) | Converts the longvarbinary values of the geometry column into Well-Known Text (WKT) format, a standard format for representing geometry objects. |
| GeometryDistance | GeometryDistance(shape_expr1,shape_expr2) | Calculates the distance between two shapes. |
| GeometryRelate | GeometryRelate(shape_expr1,shape_expr2) | Determines whether one shape is inside another shape. |
| GeometryWithinDistance | GeometryWithinDistance(shape_expr1, shape_expr2,distance_expr) | Determines whether two shapes are within a specified distance of each other. |
Descriptions of the arguments that you can use with the geometry data type:
- shape_expr - Represents any valid geometry column or shape expression.
- shape_expr1,shape_expr2 - Represents any valid geometry column or shape expression.
- distance_expr - Represents any expression that evaluates to a numeric value in meters.

