Hide Columns in Visualizations
The topics in this section explain how to hide columns in a visualization and why it's useful.
About Hidden Columns
In Oracle Analytics, you can hide a column in a visualization when you want to use the column, but not show it to end users.
Note:
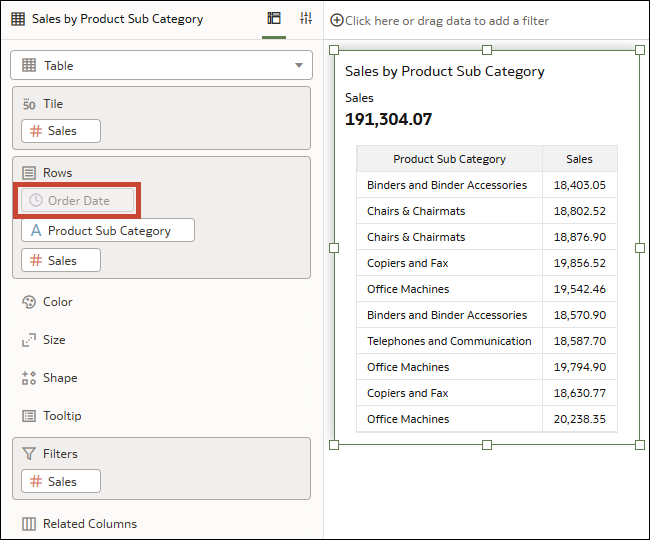
Hidden columns in the visualization affect the grain of the visualization query.For example, you might want to sort the data in a table visualization called Sales by Product Sub Category using the column Order Date, but you might not want that column to be visible in the table. When you select a column to hide, the data element is grayed out in the Grammar pane.
Description of the illustration hidden_columns_sort_example.png
- The hidden column's name is visible in any tooltips.
- The hidden column is available to use in the visualization's Sort By, Drill, and Drill to menus.
- If you're using the hidden column in a filter, its name is visible within the filter name. You can hide the filter in the filter bar, dashboard filter, or visualization filter toolbar, as applicable. See Filter Data.
- Trellis Columns
- Trellis Rows
- Category
- Rows
- Color
- Shape
- Detail
You can use hidden columns in data actions. Additionally, any series or datapoint coloring used in a visualization still considers hidden columns.
You can't hide columns for map or network chart visualizations, nor can you hide calculations for any visualization type.
Hide a Column in a Visualization
Hide a column in a visualization so it isn't visible to end users.
- On the Home page, hover over a workbook, click Actions, then select Open.
- Click a visualization to select it.
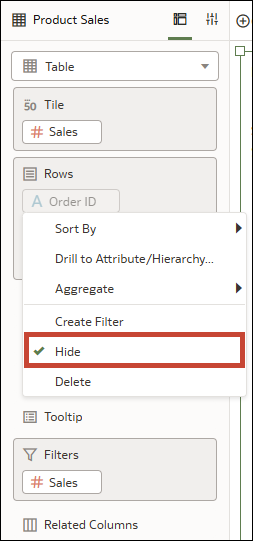
- In the Grammar panel, locate the column you want to hide, right-click the column name, and then select Hide.
- Click Save.
