Get Started with Calculations
Calculations enable you to create reusable artifacts to enhance your analytics content. For example, you might calculate the a moving average or concatenate two text fields.
With calculations, you can create aggregates, strings, math functions, dates, filters, analytics, and spatial functions. For a full list of supported functions, see Functions.
- Calculations enable you to create data elements based on a wide range of expressions and functions. For example, contatenate text, create clusters or outliers, or calculate median values.
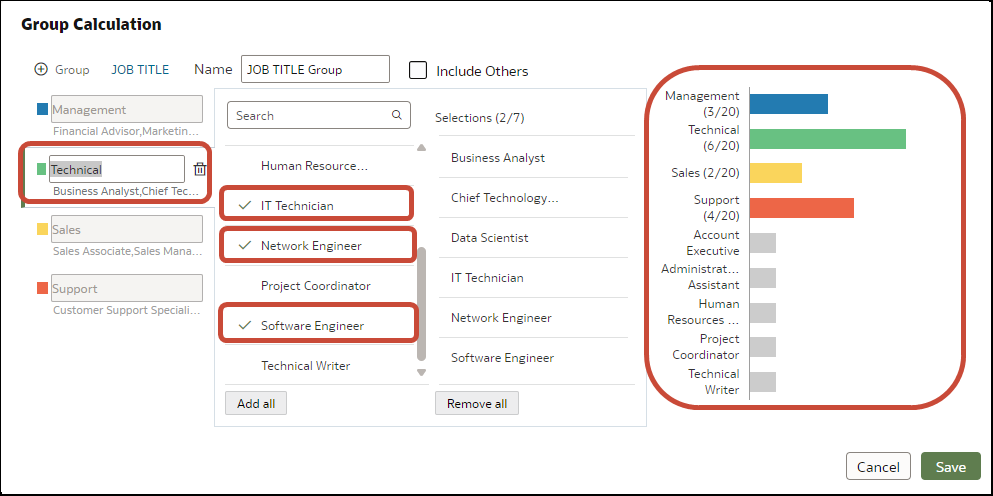
- Group Calculations enable you to categorize you data for easier analysis. For example, you might create job categories Management, Sales, Technical, and Support so that you can assign job titles to these categories and report on them.
Working With Calculations
When you create calculations in workbooks, by default they're stored in the My Calculations area of the workbook where you created them. 
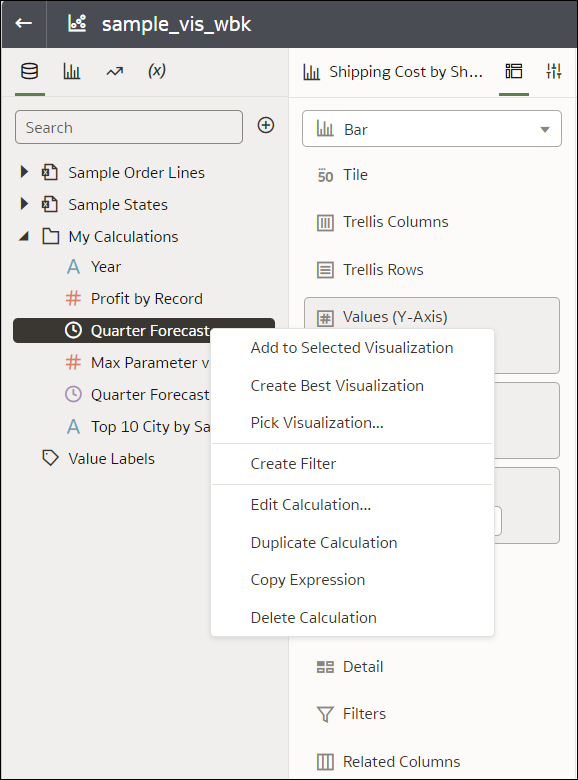
Description of the illustration using-calculations.png
You can organize your calculations by creating multiple levels of subfolders in the My Calculations area of the Data Panel. See Create a Folder to Store Calculations in a Workbook.
| Option | Use this option to |
|---|---|
| Add to Selected Visualization | Add the calculation to visualizations on the currently displayed canvas. |
| Copy Expanded Expression | (Displayed when a calculation references another calculation, known as a nested calculation) Copy the expression that is formed by replacing the referenced calculations with their source expressions recursively. In other words, the nested expressions are copied, replacing the name of the nested calculation. |
| Copy Expression | Review and copy the underlying SQL code used by the calculation. If the calculation references another calculation, the nested expressions aren't copied. |
| Create Best Visualization | Let Oracle Analytics create a visualization for you based on the best style for the data that you have. |
| Create Calculation | Add a calculation to the workbook. |
| Create Group Calculation | Add a group calculation to the workbook. |
| Create Filter | Filter the workbook or visualization using the calculation. |
| Create Folder | Create subfolders under the currently selected folder to organize your calculations. You can then drag and drop existing calculations into the subfolders. |
| Delete Calculation | Remove the calculation from the workbook. |
| Delete Folder | Remove a folder from the workbook. You can only delete empty folders. |
| Duplicate Calculation | Create an editable copy of the calculation. |
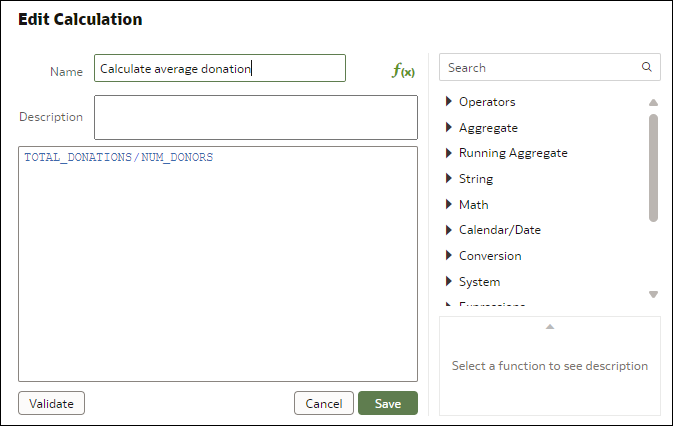
| Edit Calculation | Update the calculation. |
| Pick Visualization | Add the calculation to the canvas using a visualization style that you select from a list of suitable styles. |
| Rename Folder | Change the name of a folder. |

