Explore Contextual Insights for a Visualization
Use Contextual Insights to compare specific data selections with the rest of the data in a visualization.
Contextual Insights remembers your insight selections while you are signed in. If you sign out of Oracle Analytics and sign back in, Contextual Insights shows you the default insights generated by the algorithm.
- On the Home page, hover over a workbook, click Actions, then select Open.
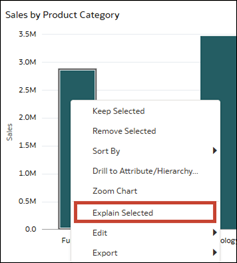
- Click one or more data points in a visualization to select them, then right-click and click Explain Selected.
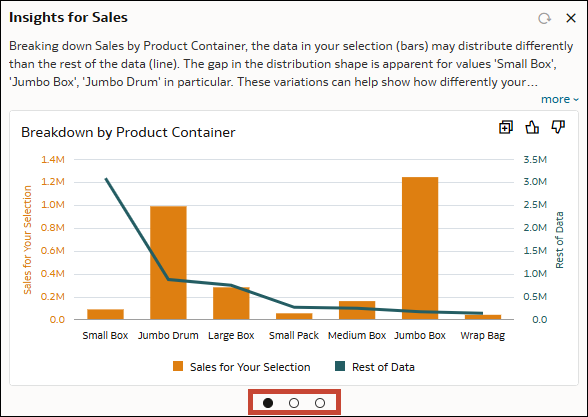
- In the dialog, browse through the insights.
- Like or reject the insights generated for you.
- Select a different data point in the visualization and generate new insights.
- With the dialog open, select a different data point in the visualization on the canvas.
- Click the Refresh icon
 to get insights for the new data point that you selected.
- Apply filters and refresh the insights.
- With the dialog open, add a filter to the canvas or visualization.
- Click the Refresh icon
 to get insights that take the filters into account.

