Enable and Configure Contextual Insights for a Visualization
As a content author, you can enable Contextual Insights for individual visualizations on a canvas and specify which columns the algorithm uses to generate the insights.
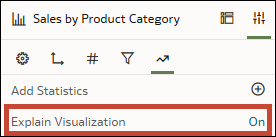
The Explain Visualization property is turned off by default when you create a new visualization. You can enable it for most visualization types, with the exception of Tile, Map, and Correlation Matrix. Once the property is switched on, users can explore the auto-generated insights.
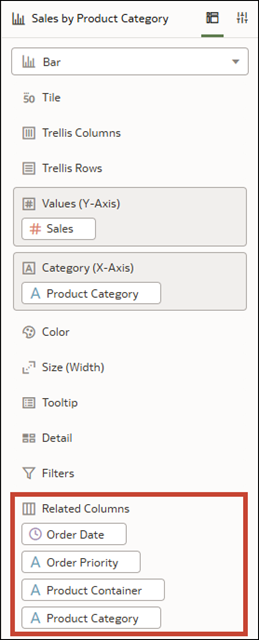
You can also specify which columns you want the AI algorithm to consider when generating insights. You do this by adding them to the Related Columns section of the Grammar panel for your visualization. Before you allow others to explore the Contextual Insights generated from your selections, take some time to review the insights yourself and make adjustments as needed.
The Contextual Insights algorithm evaluates the related columns and identifies the ones that show the highest contrast between the data you selected and the rest of the data in the visualization.
You can add up to 30 related columns. These columns can be attributes, metrics, date and time columns, or calculations, however the algorithm only uses those it considers eligible. For example, only calculations that use simple functions such as string or cast functions are considered. If you add multiple date columns, only the first is considered.
For XSA datasets (Non Subject Area-based sources), Contextual Insights automatically identifies the most appropriate columns to use to generate the insights. However, Oracle recommends that you add relevant columns to yield meaningful insights. For subject areas, you must add related columns to generate Contextual Insights for visualizations using data from those subject areas.
Enable Contextual Insights for a Visualization
As a content author, enable Contextual Insights for a visualization.
- On the Home page, hover over a workbook, click Actions, then select Open.
- In Visualize, click a visualization.
- Click Properties to open the Properties pane, and then click Analytics.
- Click the Explain Visualization field and select On.
- Click Save.
Configure Contextual Insights for a Visualization
As a content author, specify which columns you want the Contextual Insights algorithm to consider when generating insights for a visualization.
- On the Home page, hover over a workbook, click Actions, then select Open.
- In Visualize, click a visualization.
- Click Grammar to open the Grammar pane and scroll to Related Columns.
- From the Data pane, drag the columns you want Contextual Insights to use to Related Columns.
- Click Save.
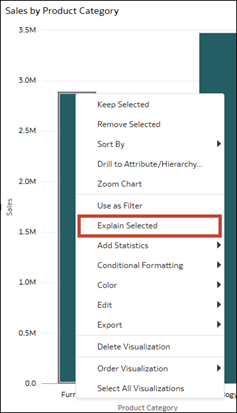
- To test that Contextual Insights work as intended, select one or more data points in the visualization, right-click, and then click Explain Selected.


