About Using Parameters to Show or Hide Visualizations
You can show or hide visualizations based on the selected value of a parameter to save space on the canvas and enable your consumers to focus on specific data.
You can configure the Visibility Parameter property for any visualization (except those created from custom plugins) to show or hide the visualization based on how a parameter's specified available values match the user-selected values. Using the parameter as a filter enables your consumers to select the parameter values and control whether the visualization is shown or hidden.
The visualizations are hidden only in Preview, not in Edit mode.
When a visualization is conditionally hidden, the canvas layout doesn't change. This means that if you design the canvas layout using Auto Fit, when the visualization is hidden, there's an empty space where it was on the canvas. You can use the Freeform canvas layout to overlay visualizations on top of each other so that one is shown in the space on the canvas while the other is hidden.
Visibility Parameter Settings
- None - Doesn't conditionally hide the visualization, it's always visible. This is the default setting.
- Parameter Name - Lets you select a parameter from a list of existing parameters, if available. You can create a parameter in advance specifically for the purpose of showing or hiding the visualization, and then select it from the list.
- Create a Parameter - Creates a basic parameter for you called Show Visual with two available values, Show and Hide. You can modify this parameter to suit your needs.
When you select a parameter for the Visibility Parameter property, you must use the Visibility Settings dialog to choose a condition and specify which of the parameter's available values to apply it to. Then, when a user selects a value, the visualization is shown or hidden depending on the condition you set.
- Any - Displays the visualization when any of the values specified in the parameter condition are included in the user-selected values.
- Subset - Displays the visualization when any of the values specified in the parameter condition are the only user-selected values.
- Exact Match - Displays the visualization when all of the values specified in the parameter condition match all of the user-selected values.
- Superset - Displays the visualization when all of the values specified in the parameter condition are included in the user-selected values.
Condition Examples
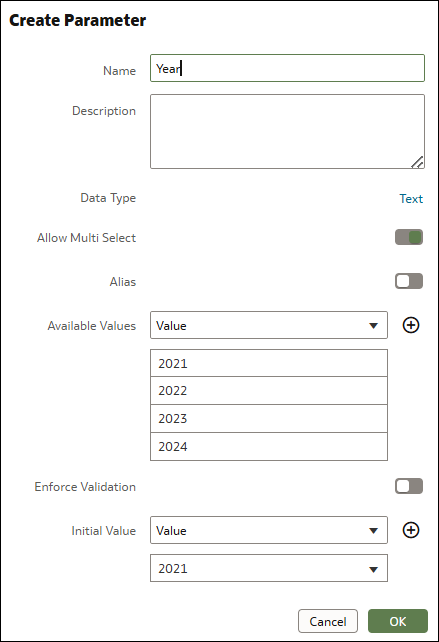
Suppose you select a parameter called Year using the Visibility Parameter property for a visualization.
- 2021
- 2022
- 2023
- 2024
Suppose you select 2023 and 2024 for the parameter condition in the Visibility Settings dialog.
- Any - The visualization is displayed when a user includes either 2023 or 2024, or both in their selections.
- Subset - The visualization is displayed when a user selects either 2023 or 2024, or both, and nothing else.
- Exact Match - The visualization is displayed when a user selects both 2023 and 2024, and nothing else.
- Superset - The visualization is displayed when a user includes both 2023 and 2024 in their selections.
