Use a Parameter as a Dashboard Filter Control
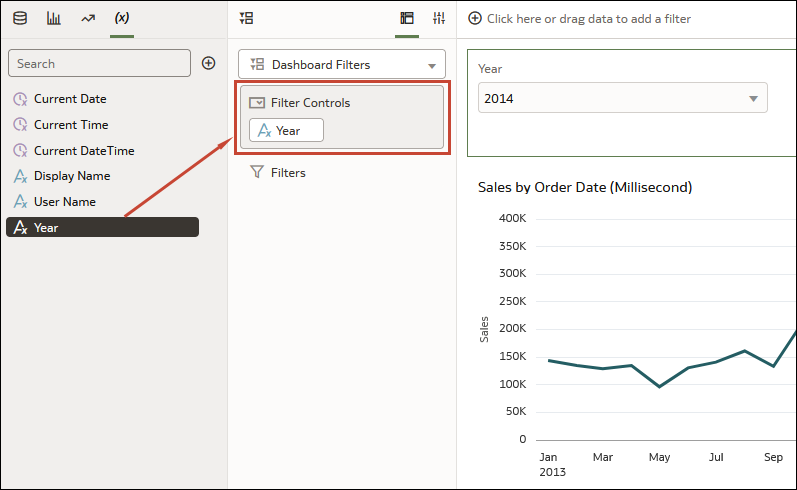
You can use a parameter as a dashboard filter control to select and change the dimension and measure column values for the visualizations on a canvas.
These tutorials provide use cases explaining how to use a parameter in the
dashboard filter control:
Note:
Adding a parameter as a dashboard filter control functions as a column selector, it doesn't filter data.Using a parameter as a dashboard filter control doesn't provide the same features as a standard filter. For example, it doesn't provide the Top Bottom N, exclude, nulls, or limit values functionalities.
You can also use parameters to bind a dashboard filter to a corresponding filter in other canvases in the workbook. This allows you to pass a selected filter value from one canvas to another. See Create and Bind a Parameter to a Dashboard Filter.
- On your home page, hover over a workbook, click Actions, then select Open.
- In the Data Panel, click Visualizations, scroll to the Dashboard Controls section, and drag Dashboard Filters to the canvas.
- In the Data Panel, click Parameters, and
drag and drop a parameter to Filter
Controls in the Dashboard Filter
visualization's Grammar pane.

- Click Save.