How Selection Steps and Filters Differ
It's important to understand the differences between filters and selection steps in workbooks so you can apply them effectively.
Purpose and Application
Filters act on individual columns to reduce or focus the data in one or more visualizations. Filters can apply to any visualization that uses data from the same dataset or subject area as the filter, including joined datasets. For more information, see About Filters.
Selection steps act on hierarchies and don't actually filter the data in visualizations. Instead, they specify which levels or members from the hierarchy are displayed in any visualizations that use the same hierarchy that the selection step is based on. Selection steps have no effect on visualizations that don't use the same hierarchy.
Impact on Aggregation
Filters are applied to data before aggregation and therefore affect any aggregate values in visualizations. Selection steps are applied after aggregation and therefore have no impact on aggregate values.
For example, suppose you have a table visualization named Revenue in 2010 that uses attribute and measure columns to show revenue by quarter for the year 2010, including the grand total for the whole year.
Description of the illustration selection_steps_example_aggregation_filter1.png
If you add a canvas filter in the workbook filter bar to exclude the first quarter of 2010, the row for the first quarter disappears from the table and the grand total for the whole year changes to reflect the excluded filter value.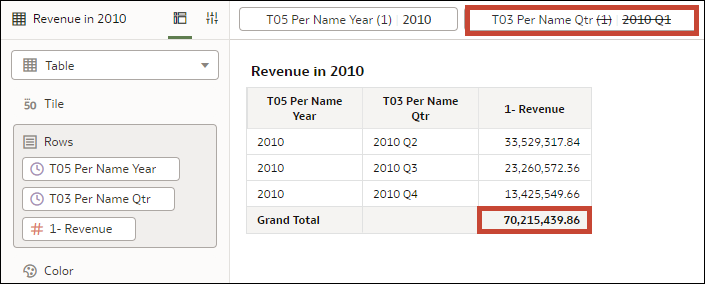
Description of the illustration selection_steps_example_aggregation_filter2.png
Now suppose your table visualization uses a time hierarchy to show the same data, now named Revenue in 2010 (Time Hierarchy).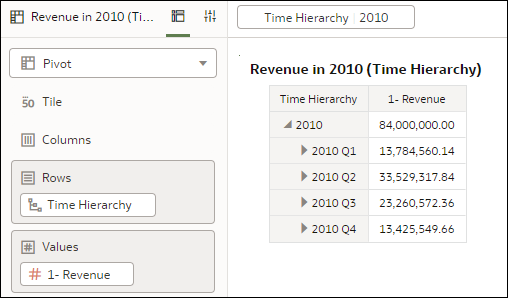
Description of the illustration selection_steps_example_aggregation_ss1.png
If you add a selection step in the workbook filter bar to remove the first quarter of 2010, the row for the first quarter is gone from the table, but total revenue for the whole year doesn't change. This is because that selection step is applied after the query for revenue in 2010 was aggregated so it's only removing the 2010 Q1 member from the visualization.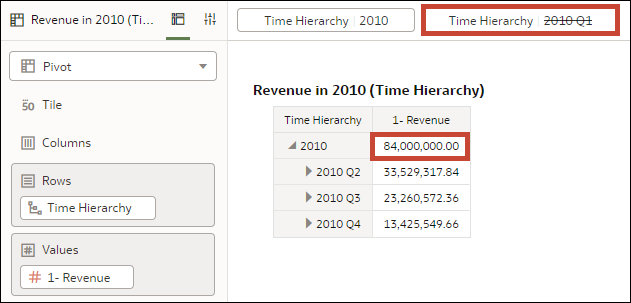
Description of the illustration selection_steps_example_aggregation_ss2.png
Order of Operation
In the workbook filter bar, the order in which workbook or canvas filters appear is irrelevant. However, the order in which selections steps appear is critical because it dictates the order in which they're applied.
For example, suppose you have a table visualization named Revenue in 2010 that uses a time hierarchy to show revenue by quarter for the year 2010, including the total revenue for the year. Suppose the first selection step in the filter bar starts with the year 2010 and then removes the first quarter, 2010 Q1, so only the revenue amounts for the year itself and the remaining three quarters are displayed.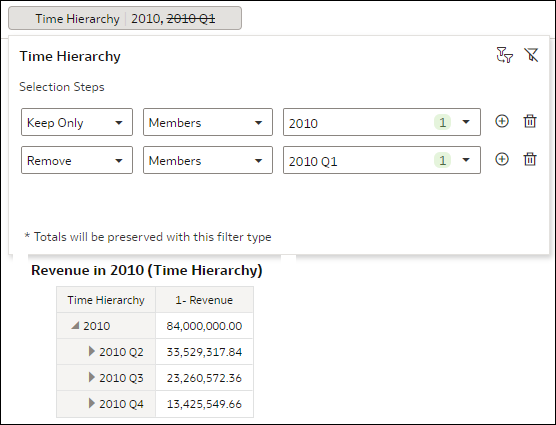
Description of the illustration selection_steps_example_order_before.png
If you add another, separate selection step in the filter bar that adds back the first quarter, 2010 Q1, the visualization displays all four quarters for the year 2010, as expected.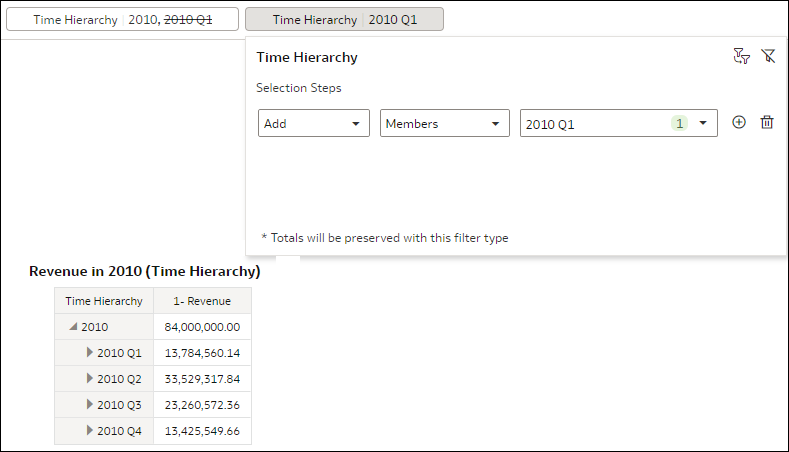
Description of the illustration selection_steps_example_order_add.png
If you swap the order of these two selection steps in the filter bar, the visualization doesn't display any data. This is because now, the selection step adding the member 2010 Q1 is applied first so the visualization starts with only 2010 Q1. The second selection step to keep 2010 and remove 2010 Q1 doesn't work because you can't keep the member 2010 if it's not in the selection to begin with.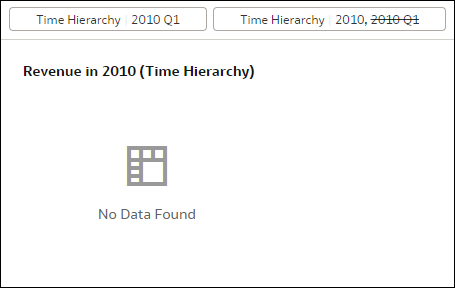
Description of the illustration selection_steps_example_order_swap.png
It's important to make sure the selection steps appear in a logical order so that when they're applied, the visualization displays the data you expect.