5.10 Clustering
This topic describes the information about the Clustering.
Clustering is an unsupervised learning technique that groups similar records into coherent clusters so that items within a cluster are alike, and clusters are meaningfully different from one another. In practical terms, it discovers natural groupings in data based on feature similarity, helping reveal patterns such as distinct customer profiles, behaviours, or risk cohorts without needing predefined labels.
- From Home screen, click Machine Learning. Under Machine Learning, click Clustering.
The Clustering screen is displayed.
- Specify the fields on the Clustering screen.
For more information on fields, refer to the field description table.
Note:
The fields marked as Required are mandatory.Table 5-22 Clustering – Field Description
Field Description Use case name Select an existing use case defined in model definition for clustering. This field is Required.
Description This value is fetched from the Use Case definition. This is read only field.
Clustering Type Select the clustering type from the drop-down list. The available options are:The default value is Auto.- Auto: Algorithm selects number of clusters automatically
- Custom: User manually set the number of clusters as per business requirements
Custom Cluster This field is enabled only when Clustering Type is selected as custom; Key in the desired number of clusters. This field is mandatory if Clustering Type selected is Custom.
- Select the use case name from the drop-down list.
- Select Clustering Type from the drop down list.
- Auto: Select Auto to let the algorithm determine the cluster count by recursively partitioning the data until clusters are internally homogeneous and distinct. Use this when you do not have a predefined number and want data-driven groupings.
- Custom: Select Custom to specify a fixed number of clusters; the model will create that many clusters as the upper limit. Use this when business require a pre-determined set of clusters.
Note: Provide the cluster count as a non-decimal number in the Custom cluster field.
- Click Clustering to train the model for the selected use case.
Allow a few seconds for the UI to populate.
- After trying out either Auto or Custom as per business needs, click Batch Scoring to predict the clusters of the inference data source, using the auto or custom cluster model .
The predictions of batch scoring are now available for business consumption.
Clusters The cluster map provides a quick visual snapshot of clustering results by showing each cluster as a box, larger boxes indicate more records in that cluster. The clusters are arranged in decreasing order based on number of records from top-left to bottom-right. Hovering the cursor over a box displays the exact record count for that cluster.
The Cluster Features presents the profile of the currently selected cluster with its exact record count and updates automatically when a cluster is chosen. It contains four columns- Feature, Mean, Variance, and Mode, where Feature lists the key training columns used by the model, Mean and Variance describe numerical features within the cluster, and Mode reports the most frequent category for categorical features.
Clustering Visualization (Auto)
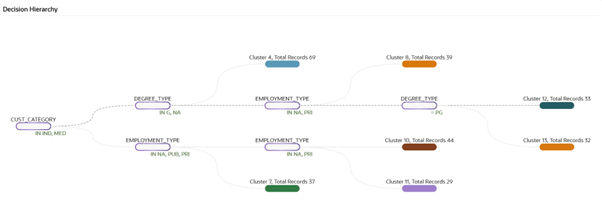
In auto mode, the visualization presents a decision tree (see figure i) read from left to right, with non-coloured nodes indicating intermediate decision points and coloured nodes represent the leaf node, indicating the final clusters. Links trace the decision path from parent to child nodes, and selecting a leaf highlights the complete path to that cluster. Both numerical and categorical split conditions are supported, enabling clear traceability of how auto feature-based rules form each cluster and allowing comparison by inspecting paths and terminal nodes.
Clustering Visualization (Custom)
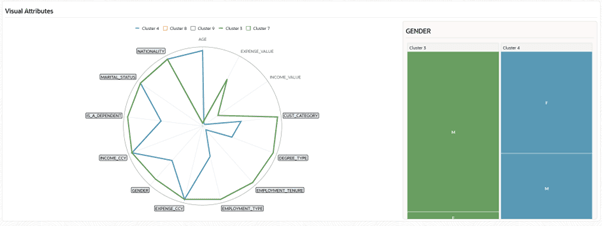
In custom mode, the visualization presents a spider chart of centroids (see figure ii), where each axis represents a training feature, and each line represents a cluster’s average values across those features. Multiple clusters can be displayed simultaneously for profile comparison, with optional focus on selected features as needed.
Categorical features are represented by grey boxes in the spider chart and features values are indicated by an additional per-cluster category box map that appears when a highlighted categorical feature is selected, providing distributions and percentages to understand category dominance across clusters.
Numerical feature values are available on mouse hovering on peak points within the spider chart.
For cluster comparison, select more than one cluster in the legend above.
Parent topic: Machine Learning Framework


