This topic describes information about the Anomaly Detection.
Anomaly detection in machine learning focuses on identifying patterns in data that deviate from expected behavior. These “anomalies” or “outliers” can signal critical events such as fraud, system failures, security breaches, or data quality issues.
- From Home screen, click Machine Learning. Under Machine Learning, click Anomaly Detection.
The
Anomaly Model Build screen is displayed.
- Specify the sensitivity field on Anomaly Model Build screen.
Note:
The fields marked as
Required are mandatory.
For more information on fields, refer to the field description table.
- Click Build to triggers the model building process based on the selected use case and sensitivity.
Model Output
This section displays the results after the model is built.
Note:
The fields marked as
Required are mandatory. For more information on fields, refer to the field description table.
Table 5-24 Anomaly Model Build - Field Description
Anomaly Query
This section helps you apply the model subject to a probability threshold value, which is determined by business based on risk sensitivity, to highlight unusual records and save selected results as cases for investigation.
- Under Anomaly Detection, click Anomaly Query.
The
Anomaly Query screen is displayed.
- Specify the fields on Anomaly Query screen.
Note:
The fields marked as
Required are mandatory.
For more information on fields, refer to the field description table.
- Click Query button to run the model with the selected use case, threshold, and display settings.
Populates the results table.
Note:
The fields marked as
Required are mandatory.
For more information on fields, refer to the field description table.
- Click the Save to save all identified anomalies along with the current query settings for future investigation.
Note:
If
Anomalies is selected but the threshold is set too high, fewer than N results may be displayed.
If Records is selected, the probability for each item is shown; only items at or above the threshold are considered anomalies.
Investigative Dashboard
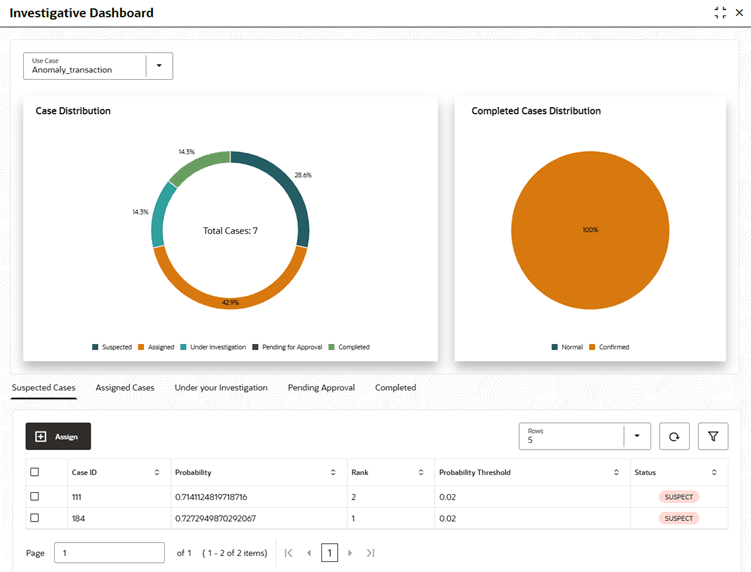
This dashboard helps you review, assign, investigate, and close out anomalies that were saved as cases from the Anomaly Query step.
- Under Anomaly Detection, click Investigative Dashboard.
The
Investigative Dashboard screen is displayed.
- Select the Use Case to load its cases and metrics.
- Review the Case Distribution to view counts across Suspected, Assigned, Under your Investigation, Pending Approval, and Completed.
- Open Suspected Cases, select the anomaly records, and click Assign to route them to the appropriate owner.
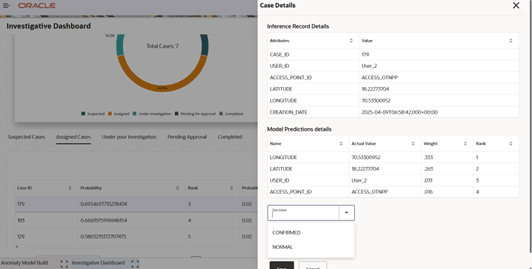
- The assignee reviews the case under Under your Investigation, records findings, and sets the outcome as Confirmed or Normal.
- 15. After setting the outcome, click Submit for Approval for approval.
- The case moves to Pending Approval.
On approval, the case is closed and appears under Completed; if rejected, it returns to Under Investigation for further action.


