3.4.6 Monitoring JMS Queues
OFSLL uses MDB infrastructure as an interface for asynchronous communication with thirdparty integrated applications and all the outgoing communications through all the interfaces are tracked in JMS Queues tab.
The JMS Queues tab in System Monitor screen facilitates as a dashboard to monitor the status of all the configured MDB (Message-Driven Bean) queues and provides a statistics of the total messages / requests that are sent from OFSLL to external system along with their status.
- Status sub tab - to view the last status of configured MDB
- Messages sub tab
- To view the list of configured interfaces and total messages triggered to the interface.
- To view the status of response for the message received from the interface.
- To Re-submit failed messages.
- Click Dashboard > Dashboard > System Monitor > JMS Queues. The Status sub tab is displayed by default.
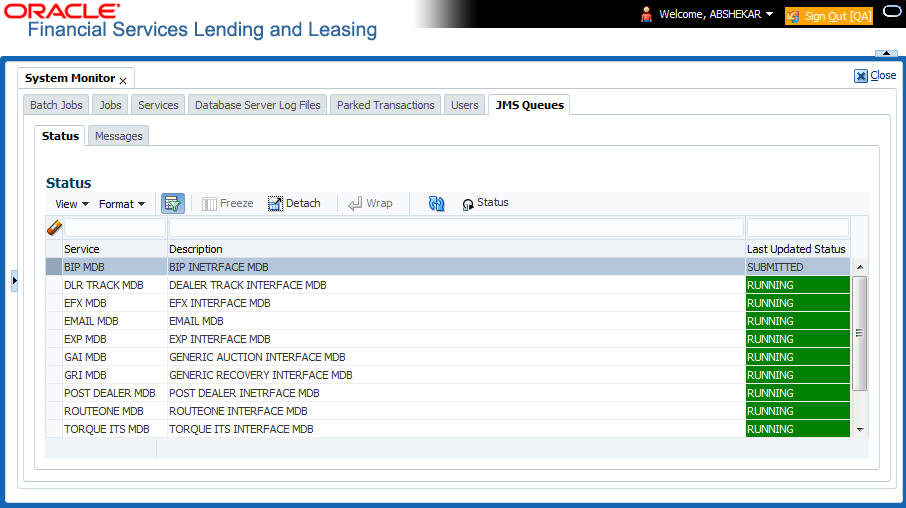
- In the Status section, you can view the following details of configured MDB:
Table 3-18 Status
Field View this: Service Displays the name of the message service suffixed by MDB to differentiate the different MDB services. Description Displays the description or abbreviated name of MDB interface. Last Updated Status Displays the status of MDB interface. Following are the status displayed:- UNKNOWN - indicates that no MDB infrastructure is connected or status ping message is not sent to that MDB.
- SUBMITTED - indicates that a dummy ping message is sent to MDB.
- RUNNING - indicates that the message is consumed by MDB infrastructure.
- STOPPED - indicates if MDB infrastructure is down.
- In the Status section, select the required service for which you need the status and click Click
 button. On clicking, a dummy ping is sent to the interfaced server and status in Last Updated Status column is updated as SUBMITTED.
- Click
 (refresh) button, to fetch the latest status and the response received is updated in Last Updated Status column.
- Click Dashboard > Dashboard > System Monitor > JMS Queues > Messages tab.
- In the Messages section, filter the list of messages using the following options:
- Select the required Company from the drop-down list to view JMS message at company level. The list is populated only with those Company Definitions to which you have been provisioned access. By default, ALL is selected.
- Select the View Last option to display the messages based on elapsed days by selecting 1 Day (default) / 1 Week / 1 Month / By Date. If By Date option is selected, you can specify a date range (within 3 months) in Start Dt and End Dt fields using the adjoining calendar.
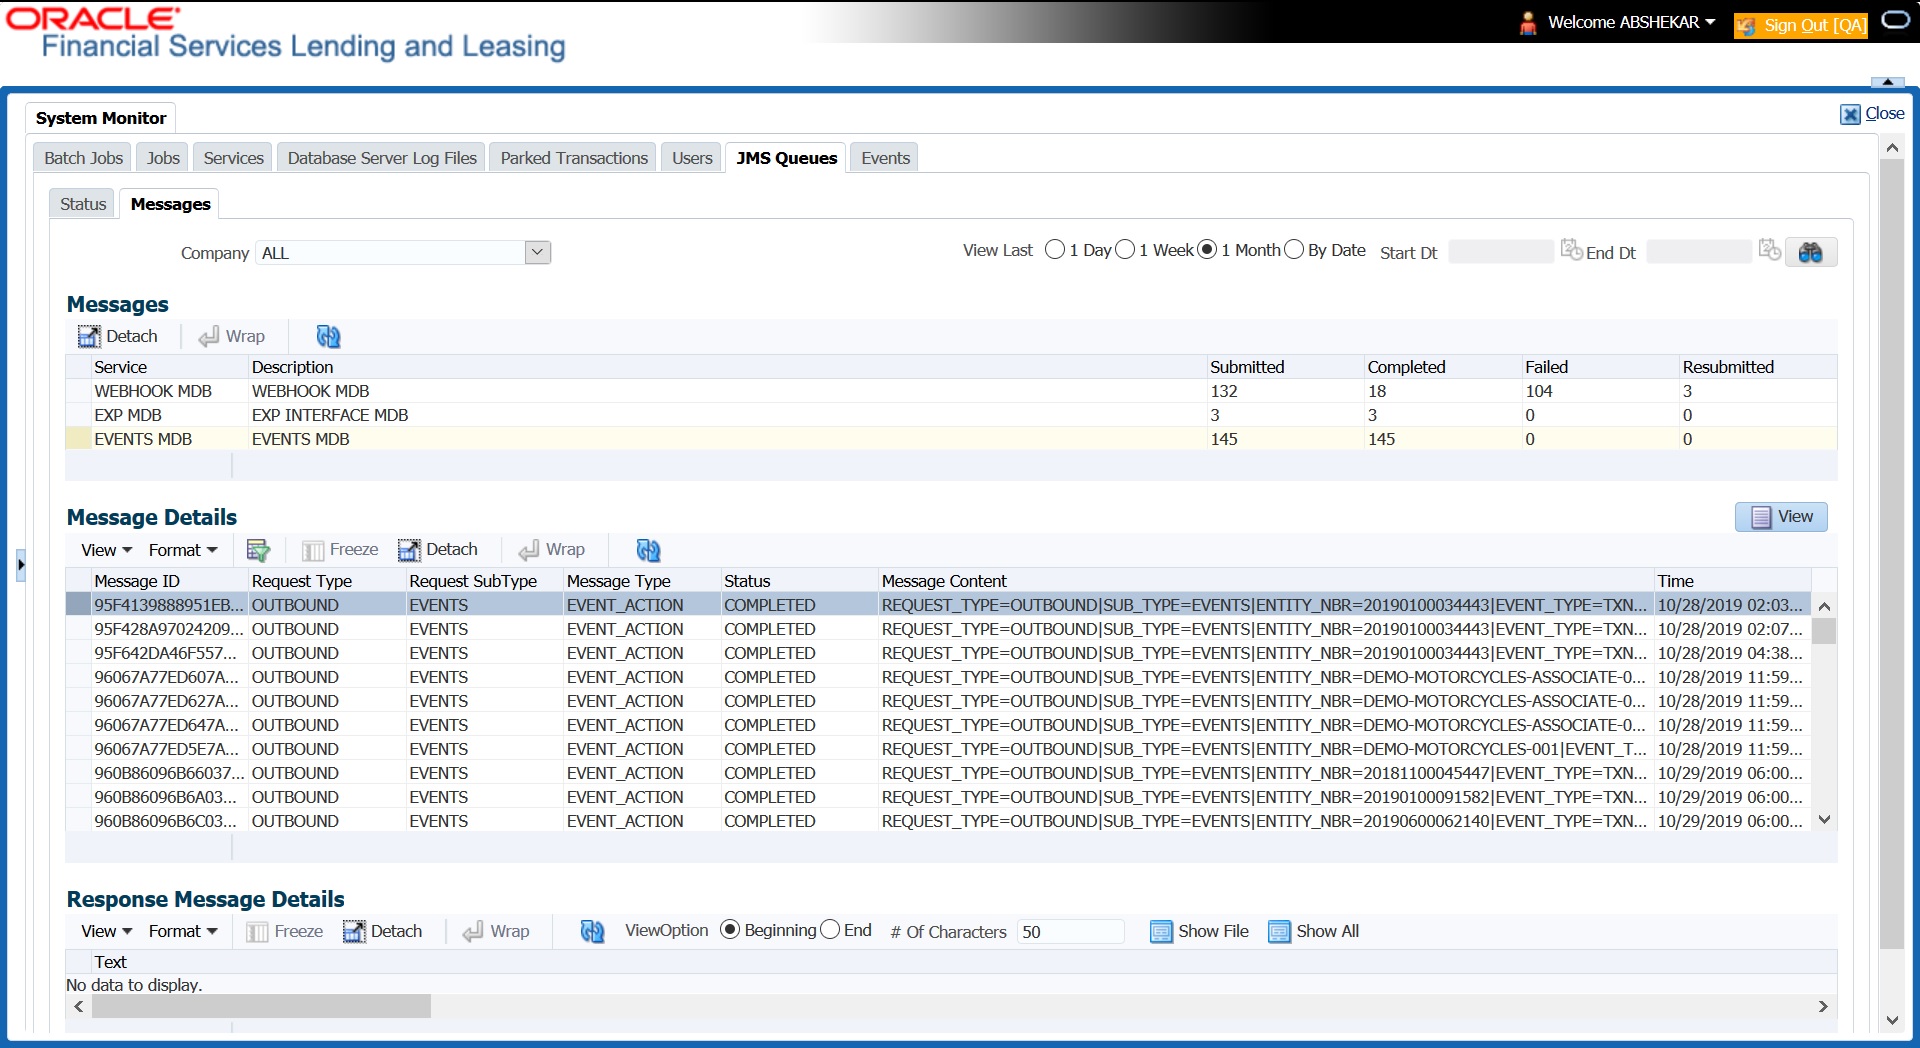
- The Messages section displays the list of configured interfaces and the total of messages exchanged between OFSLL and MDB in Submitted, Completed, Failed and Resubmitted status. Click
 (refresh) button to update the latest status.
- In the Messages section, you can view the following details:
Table 3-19 Messages
Field View this: Service Displays the name of the message service suffixed by MDB to differentiate the different MDB services. Description Displays the description or abbreviated name of MDB interface. Submitted Displays the total count of requests submitted. Completed Displays the total count of requests completed. Failed Displays the total count of requests failed. Resubmitted Displays the total count of only those requests which are failed and resubmitted again for processing.
- Click Dashboard > Dashboard > System Monitor > JMS Queues > Messages tab.
- In the Messages section, select the required MDB interface.
- The Message Details section below displays the list of messages sent to the interface with the following details:
Table 3-20 Message Details
Field View this: Message ID View the system generated MDB message ID Request Type View the message request type Request SubType View the message request sub type Message Type View the message identifier Status View the message processing status Response This column data is displayed only for Webhook MDB.
View the HTTP Header received as response during Webhook event action invocation.
Message Content View the message content Time View the message time stamp - In the Message Details section, select the message in Failed status. Click
 (refresh) button to update the latest status.
- (Optional) You can click View to display the selected record in Message Details section.
- Click Re-submit. The details are triggered again for processing and the Resubmitted counter in Messages section is updated along with other counters.
Response Message Details
This section is enabled if Events or Webhook type of MDB service is selected in Message section and displays the request Message Details that is propagated to external system for the posted event action.
- Select the required record from the Message Details section and click Show File.
The first 50 characters of the request in json format is displayed since the default preference selected is Beginning in View option and # of Characters is set to 50.
- You can customize the preference using View Option (Beginning / End) and specifying the number of characters to be displayed.
- Also you can click Show All to display the complete request.
Parent topic: System Monitor

