2.2.1 File Monitoring
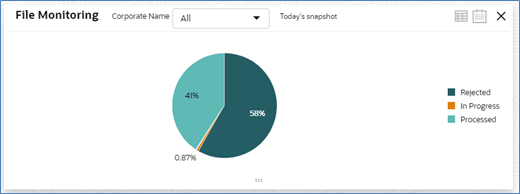
This widget displays the processing status wise break up, in the form of a pie chart or a table, for the files received during the day. A sample snapshot of a day:
Figure 2-3 File Monitoring
The following details are displayed in the widget:
- Hover the pie chart slice to view the file count
- Percentage of status in each pie
- Status legends
- Filter the files based on Corporate
- Filter the data based on the date range
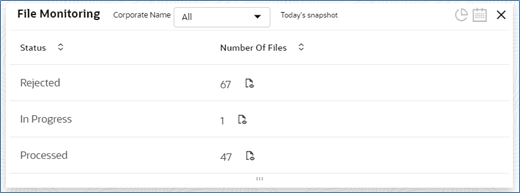
- Click on Table view icon, to view the total number of the files received across status
- Click on the File eye view to view the Inquiry details of the files for the respective status
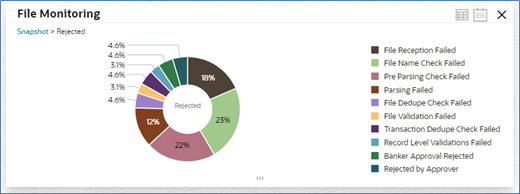
- Each status can be further drilled down to know the actual status of the file.
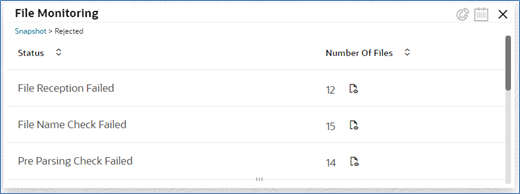
Figure 2-4 File Monitoring
The following details are displayed in the widget:
- Hover the pie chart slice to view the file count
- Percentage of status in each pie
- Status legends
- Filter the data based on the date range
- Click on Table view icon, to view the total number of the files received across status
- Click on the File eye view to view the Inquiry details of the files
The bank user can perform following actions on Today’s snapshot widget:
- Based on the transaction category selected from the drop-down, the pie chart will display the status wise break-up in percentage terms.
- When “All” is selected in the drop-down menu, data corresponding to All corporates will be displayed
- To view the file count instead of percentage break-up, click on flip button at the top-right
The columns in the widget are as below:
Table 2-1 Columns in the widget
| Column | Description |
|---|---|
| Status | Displays the logical statuses traversed by a file |
| Number of Files | Displays the count of files available under logical status and the file eye view to redirect to the File Inquiry screen |
Parent topic: Dashboard


