2.1 Assets at Risk
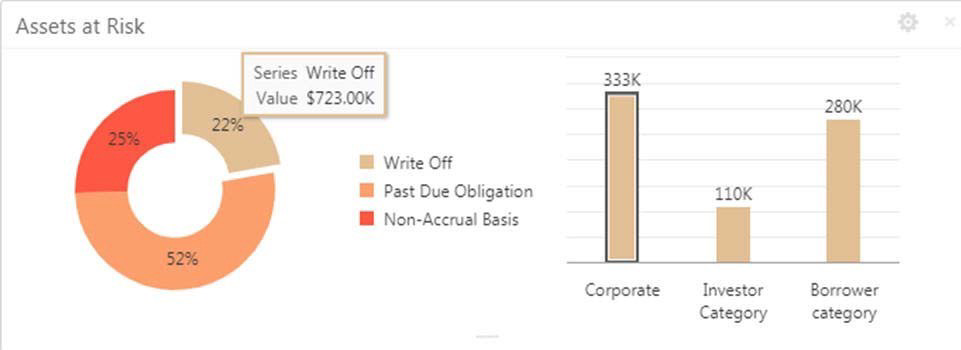
Use Assets at Risk to display the performance of the asset in a pie and bar chart.
Display the performance of the asset as a pie-chart. The asset performance is derived
in the system based on the borrower's repayment. Data from the loan product processor is
periodically refreshed for this widget. This widget displays the total value of the
holding asset and percentage wise status. A sample of the asset performance is
illustrated
.
The following details are displayed in the widget:
- Total value of the asset in currency
- Percentage of status in each pie chart
- Click each pie chart, the customer category-wise total asset value is displayed as bar chart.
- Click each bar, the Summary View of the Corporate lending loan contracts is shown for the Transaction Branch, Currency, Customer Category and Loan status combination.
- You can filter the details based on the Customer Name or Relationship Manager
- You can sort the displayed results under various categories.
Related Topics
Parent topic: Dashboard
