Performance
Oracle Communications Unified Assurance includes a library of devices for out-of-the-box polling support of useful metrics. Performance Common Object Model (PCOM) is used for retrieving various metrics that represent system performance. These metrics are represented as definitions in JSON format that define the Simple Network Management Protocol (SNMP) OIDs needed to satisfy basic polling functionalities like CPU, memory, disk, network, temperature, fan, interfaces, and so on.
Performance Support Workflow
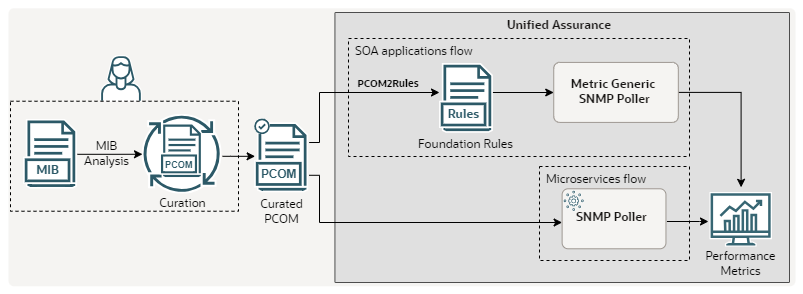
Description of illustration performance-support-workflow.png
Performance support starts with Management Information Base (MIB) files. MIBs are structured collections of information in a hierarchical format that define the characteristics and status of network devices in the form of objects and object tables.
An object is a specific piece of data or resource that can be managed or monitored on a network device. These network devices are monitored using SNMP.
You must go through MIBs related to the devices you want to get metrics for, and find the relevant objects and object tables. PCOM curation is the process of adding relevant information from the MIB file to a PCOM file and arranging it in a proper manner. Once you have arranged objects in the PCOM file and configured them properly, the PCOM curation is complete and the file is ready to be tested.
There are two different flows for testing:
-
The PCOM file is directly used by the SNMP Poller microservice to poll device information and help in generating performance metrics. See SNMP Poller in Unified Assurance Implementation Guide for more information.
-
The PCOM file is converted into foundation rules, which are Perl definitions of how the PCOM file information shall be executed. These foundation rules are used by the Metric Generic SNMP Poller, which is a Service Oriented Architecture (SOA) application, to poll the device and get the metrics. See Foundation Rules and GenericSNMPPollerd in Unified Assurance Implementation Guide for more information.
PCOM Schema and Definitions
A PCOM file consists of attributes like MIB objects, OIDs, metric types, factors, and filters that determine the specifics of the device performance information to be polled. The curation process involves setting appropriate values to these PCOM schema attributes.
See Example PCOM File for an example PCOM file.
The following are the top-level attributes present in a PCOM file, along with their definitions:
-
@vendor: This attribute contains the enterprise name from the MIBs. For example, ixiaCommunications. Even if the vendor has been acquired by another vendor, the enterprise name in the MIBs is used.
-
mibs: This attribute lists all the MIBs that you use to derive the information regarding relevant metrics as part of curation. For example, IXIA-COMM-DEVICE-MIB.
-
notes: This contains any top-level meta information relevant to the vendor or device. For example, if the vendor mentioned in @vendor has been acquired by another vendor, the name of the new vendor can be noted down here.
-
enterpriseOids: This attribute lists the OIDs specifically assigned to enterprises or organizations to define proprietary objects. In the hierarchy, enterprise OIDs typically start with the prefix 1.3.6.1.4.1, followed by a unique number assigned to the organization by the Internet Assigned Numbers Authority (IANA). For example, 1.3.6.1.4.1.3054.
-
aliases: This attribute is used in cases where the curation process has been undertaken for at least one device of this vendor, and it was found that there were no vendor-specific performance metrics defined in the MIBs or used by the devices, but that they supported performance metrics defined in the PCOM file of another vendor. This is a shortcut for the Metric Generic SNMP Poller to use the metrics foundation rules of the second vendor.
-
objects: This attribute lists the PCOM objects derived from SNMP OIDs. It is empty in cases where the vendor devices contain no enterprise-specific metrics, but support mib-2-PCOM and/or performance metrics of another vendor. See Object Definitions for information on the attributes nested within objects.
Object Definitions
The following are the attributes nested within the object attribute:
-
@objectName: This attribute contains the name of the object from the MIB which is relevant in the process of providing Performance Support. It should follow the MIB name-spaced textual convention. For example, IXIA-COMM-DEVICE-MIB::deviceHwStatusMemUsage.
-
certification: This attibute indicates the level of MIB support required by the object for device integration. It can have two values: BASIC, which denotes that the object takes reference from one of the Internet Engineering Task Force (IEFT) MIBs, and STANDARD, which denotes that the object takes reference from vendor-specific MIBs. In Unified Assurance, all objects in mib-2-PCOM.json have BASIC certification.
-
class: This attribute represents the broad category of the monitored object or metric. The value should be in uppercase. For example, MEMORY.
-
subClass: This attribute represents the specific aspect or dimension of the class being measured. The value should be in uppercase. For example, USAGE.
The class and subClass attributes together act as a unique key to allow overrides from other objects within the same PCOM file. For the full list of classes and subclasses supported by Unified Assurance, see Unified Assurance Device Support Overview.
-
weight: If a PCOM file has multiple objects with the same combination of class and subClass attributes, each object has a different value for the weight attribute based on priority. The object with the highest weight value is given first priority. If that object does not have information that matches with the device instance, then the object with the next highest weight is taken. Objects with the certification value BASIC always have a weight value of 1, while objects with the certification value STANDARD have weight values starting from 2. weight values higher than 2 are generally applied in the following scenarios:
-
The vendor has a general MIB which contains metrics supported by multiple types of devices, and also has MIBs that contain performance metrics which are only used by certain devices or classes of devices, but are of the same type as metrics defined in the general vendor MIB. In this scenario, the higher weight values are assigned to the device-specific metric objects, and the lower weight value, usually 2, is assigned to the general enterprise-wide metric object.
-
The vendor has a newer MIB which defines new objects that contain metrics that are also supported on the newer versions of devices for the purposes of backwards compatibility, or the older versions of devices which only support the older MIBs are still in use in the field. In this scenario, the higher weight values are assigned to the newer metric objects.
In situations where two metrics of the same class and subClass need to have the same weight, but cannot be grouped together in the same PCOM object and differentiated using instance, then the only way of differentiating them is to add an index number to the end of the subClass name. For example, subClass : STATUS2.
-
-
notes: This attribute contains any important information about the processing.
-
method: This attribute denotes the protocol using which data is collected. SNMP is the only value for method as only SNMP-based PCOMs have been developed so far. The PCOM schema, however, is designed to be able to support other protocols.
-
snmp: This attribute contains all the SNMP imformation about the object. You can set fields within this attribute that are not needed to null. See SNMP Definitions for information on the fields nested within snmp.
SNMP Definitions
The following are the attributes nested within the snmp attribute:
-
discovery: This attribute is compulsory for all objects and specifies the name and OID of the object, using attributes called name and oid, that are used to check whether an SNMP response is available for the specified device or instance. If no SNMP response is found, no metrics are recorded for the object. Usually, either the OID of the metric to be polled or the index OID for an object table is used for discovery. However, any top-level MIB object, like a table entry or even the table object itself, can be used.
-
factor: This attribute specifies the factor of a unit relative to the unit defined in the source MIB. It is calculated as the result obtained by dividing the unit of a metric mentioned in the source MIB by the unit of the metric type standardized in Unified Assurance. For example, assume that the unit of a memory or disk metric in the source MIB is kilobyte. The standard unit for memory in Unified Assurance is byte. Then the factor would be 1 kilobyte (or 1024 bytes) divided by 1 byte, which is 1024.
-
filter: This attribute filters out instances of metrics which are invalid, of the wrong type, not set, and so on. It takes a comparison operator (represented by the operator attribute), a property (represented by the property attribute, which contains the name and oid attribute), and a value (represented by the value attribute).
-
instance: This attribute denotes the specific instance of the component for which the metric has been gathered. It contains name and oid attributes that represent the object and OID from which all entries will be picked and displayed as separate instances with their respective metrics. There are three ways to set up this field:
-
using an OID which contains the instance name for a table entry. For example, deviceCpuUsageTable.
-
using synthetic instance names which can be constructed with the index variable (
$i). For example, FAN $i or CPU $i. -
using a hard-coded instance name. For example, FAN1 or CPU.
A metric object that polls an OID that contains a performance value related to the device as a whole should have the instance attribute set to null.
-
-
maximum: This attribute denotes the maximum possible value of a metric. For example, a metric which is defined as being a percentage value would have the maximum set to 100. This field can also take its value from one of the objects from a MIB.
-
values: This attribute contains an array of objects where the metrics to be polled for an instance are defined. See Value Definitions for information on the fields nested within values.
Value Definitions
Each object within the values attribute has the following fields:
-
name: This field contains the name of the object from the MIB for which the metric data is to be polled.
-
oid: This field contains the OID corresponding to the MIB object mentioned in the name field.
-
valueType: This field mentions the type of the SNMP object being polled, as defined in the source MIB. The accepted values for this field are:
-
INTEGER
-
OCTET STRING
-
OBJECT IDENTIFIER
-
Integer32
-
IpAddress
-
Counter32
-
Gauge32
-
Unsigned32
-
TimeTicks
-
Opaque
-
Counter64
-
-
eval: This field allows a synthetic metric to be derived from the data provided by the SNMP MIB. It primarily involves evaluating a mathematical expression using the MIB objects data to derive a value. The
$objectName[$i]syntax is used to fetch values for a particular index (represented by$i) for that object from the object table. -
metricType: This field contains the name of the metric type supported by Unified Assurance with which the value collected from the device is aligned. It is required if the metric for the instance from the MIB object needs to be displayed on the UI. If the metric does not need to be displayed directly on the UI, and can be used in another metric type instead, this field can be set to null.
-
thresholds: This field contains an array of threshold names that align with the thresholds supported by Unified Assurance corresponding to the supported metric types. Based on the values of metrics polled, thresholds can trigger a fault event. You can check the thresholds available in Unified Assurance by going to the Thresholds UI. See Thresholds in Unified Assurance User's Guide for more information. If a required threshold is not available by default in Unified Assurance, you can create custom thresholds.
-
processors: This field contains a list of objects where the rules required to perform further processing on the values collected from MIB objects are defined. The following are the attributes nested within the processors attribute:
-
type: This field defines the type of the processor. There are two types: the map type is used to perform one-on-one mapping of the values from the collected data to values to which they need to be replaced with, while the extract type is to extract a certain part of the value collected from the MIB object.
-
data: This field contains an array of elements where specific rules are defined based on specific conditions. For example, for finding and replacing specific values, they are defined as separate elements in the data array. Similarly, different regex patterns can be added to the array to match and extract different types of patterns.
-
options.unknowIncrement: This field is used to provide a default value for an object if an undefined value is received from polling. This happens when the device sends a value which is not defined in the MIB as a valid enumeration for the OID. It is generally set to some value a couple of orders of magnitude away from the valid enumerated values.
-
Example PCOM File
To see the default PCOM files:
-
Go to the Rules UI.
From the Configuration menu, select Rules. See Rules in Unified Assurance User's Guide for more information on this UI.
-
Expand the following folders:
Core Rules (core)/Default read-write branch (default)/collection/metric/snmp/_objects/pcom
The following example is for reference only:
{
    "@vendor": "exampleCompanyA",
    "mibs": [
        "EXMP-COMPA-DEVICE-MIB"
    ],
    "notes": "Example Company A, bought by Example Company B.",
    "enterpriseOids": [
        "1.3.6.1.4.1.xxxx"
    ],
    "aliases": [
        "exampleCompanyB"
    ],
    "objects": [
        {
            "@objectName": "EXMP-COMPA-DEVICE-MIB::deviceMemUsage",
            "certification": "STANDARD",
            "class": "MEMORY",
            "description": "Memory information of the device.",
            "domain": "PERFORMANCE",
            "metaData": {
                "certified": false
            },
            "method": "snmp",
            "snmp": {
                "discovery": {
                    "name": "EXMP-COMPA-DEVICE-MIB::deviceMemUsage",
                    "oid": "1.3.6.1.4.1.xxxx.xxx.x.x.x.x.x.x"
                },
                "factor": 1024,
                "instance": null,
                "maximum": {
                    "name": "EXMP-COMPA-DEVICE-MIB::deviceMemUsageTotalMem",
                    "oid": "1.3.6.1.4.1.xxxx.xxx.x.x.x.x.x.x"
                },
                "values": [
                    {
                        "metricType": "Memory Used",
                        "name": "EXMP-COMPA-DEVICE-MIB::deviceMemUsageUsedMem",
                        "oid": "1.3.6.1.4.1.xxxx.xxx.x.x.x.x.x.x",
                        "valueType": "Gauge32",
                        "thresholds": [
                            "Memory High"
                        ]
                    },
                    {
                        "metricType": "Memory Free",
                        "name": "EXMP-COMPA-DEVICE-MIB::deviceMemUsageFreeMem",
                        "oid": "1.3.6.1.4.1.xxxx.xxx.x.x.x.x.x.x",
                        "valueType": "Gauge32"
                    }
                ]
            },
            "subClass": "USAGE",
            "weight": 3
        },
        {
            "@objectName": "EXMP-COMPA-DEVICE-MIB::flashMemUsage",
            "certification": "STANDARD",
            "class": "MEMORY",
            "description": "Memory information of the device.",
            "domain": "PERFORMANCE",
            "metaData": {
                "certified": false
            },
            "method": "snmp",
            "snmp": {
                "discovery": {
                    "name": "::flashMemUsage",
                    "oid": "1.3.6.1.4.1.xxxx.xxx.x.x.x.x.x.x"
                },
                "factor": 1024,
                "instance": null,
                "maximum": {
                    "name": "EXMP-COMPA-DEVICE-MIB::flashMemUsageTotalMem",
                    "oid": "1.3.6.1.4.1.xxxx.xxx.x.x.x.x.x.x"
                },
                "values": [
                    {
                        "metricType": "Memory Used",
                        "name": "EXMP-COMPA-DEVICE-MIB::flashMemUsageUsedMem",
                        "oid": "1.3.6.1.4.1.xxxx.xxx.x.x.x.x.x.x",
                        "valueType": "Gauge32",
                        "thresholds": [
                            "Memory High"
                        ]
                    },
                    {
                        "metricType": "Memory Free",
                        "name": "EXMP-COMPA-DEVICE-MIB::flashMemUsageFreeMem",
                        "oid": "1.3.6.1.4.1.xxxx.xxx.x.x.x.x.x.x",
                        "valueType": "Gauge32"
                    }
                ]
            },
            "subClass": "USAGE",
            "weight": 2
        },
        {
            "@objectName": "EXMP-COMPA-DEVICE-MIB::deviceCpuUsgTable",
            "certification": "STANDARD",
            "class": "CPU",
            "description": "CPU utilization of the device",
            "domain": "PERFORMANCE",
            "metaData": {
                "certified": false
            },
            "method": "snmp",
            "snmp": {
                "discovery": {
                    "name": "EXMP-COMPA-DEVICE-MIB::deviceCpuUsgEntry",
                    "oid": "1.3.6.1.4.1.xxxx.xxx.x.x.x.x.x.x"
                },
                "filter": [
                    {
                        "operator": "!=",
                        "property": {
                            "name": "EXMP-COMPA-DEVICE-MIB::deviceCpuUsage",
                            "oid": "1.3.6.1.4.1.x.x.xx.x.x.x.x"
                        },
                        "value": "0"
                    }
                ],
                "factor": null,
                "instance": {
                    "name": "EXMP-COMPA-DEVICE-MIB::deviceCpuUsgDescription",
                    "oid": "1.3.6.1.4.1.xxxx.xxx.x.x.x.x.x.x.x"
                },
                "maximum": 100,
                "values": [
                    {
                        "metricType": null,
                        "name": "EXMP-COMPA-DEVICE-MIB::deviceCpuUsgUserCpu",
                        "oid": "1.3.6.1.4.1.xxxx.xxx.x.x.x.x.x.x.x",
                        "valueType": "OCTET STRING"
                    },
                    {
                        "metricType": null,
                        "name": "EXMP-COMPA-DEVICE-MIB::deviceCpuUsgSystemCpu",
                        "oid": "1.3.6.1.4.1.xxxx.xxx.x.x.x.x.x.x.x",
                        "valueType": "OCTET STRING"
                    },
                    {
                        "metricType": "CPU Utilization",
                        "eval": "$deviceCpuUsgUserCpu[$i] + $deviceCpuUsgSystemCpu[$i]"
                    }
                ]
            },
            "subClass": "UTILIZATION",
            "weight": 2
        },
        {
            "@objectName" : "EXMP-COMPA-DEVICE-MIB::deviceInternalTemparature",
            "certification" : "STANDARD",
            "class" : "TEMPERATURE",
            "description" : "Internal temperature in the controller.",
            "domain" : "PERFORMANCE",
            "metaData" : {
                "certified" : false
            },
            "method" : "snmp",
            "notes" : "Display string in the format: '27.00 degrees Celsius (NORMAL)'",
            "snmp" : {
                "discovery" : {
                    "name" : "EXMP-COMPA-DEVICE-MIB::deviceInternalTemparature",
                    "oid" : "1.3.6.1.4.1.xxxxx.x.x.x.x.x.x"
                },
                "factor" : null,
                "filter" : null,
                "instance" : null,
                "maximum" : null,
                "values" : [
                    {
                        "metricType" : "Temperature",
                        "name" : "EXMP-COMPA-DEVICE-MIB::deviceInternalTemparature",
                        "oid" : "1.3.6.1.4.1.xxxxx.x.x.x.x.x.xx",
                        "valueType" : "OCTET STRING",
                        "processors" : [
                            {
                                "type" : "extract",
                                "data" : [
                                    "^(\\d+(?:\\.\\d+)?) degrees"
                                ]
                            }
                        ]
                    }
                ]
            },
            "subClass" : "VALUE",
            "weight" : 2
        }
    ]
}
PCOM Curation
PCOM curation is the process of converting a MIB to a pre-certified PCOM file. This is an entirely manual process which involves posing technical questions, obtaining answers, and subsequently generating the PCOM file.
Curation Process Flow
The curation process starts with three inputs:
-
MIBs: These vendor-specific files have the definitions of objects related to the required device performance metrics.
-
Device IP: This is the IP address of the device or device simulation server for which data is to be polled. It is mainly used while testing.
-
SNMP walk of the device: An SNMP walk file contains a list of OID-value pairs retrieved from an SNMP-enabled device, representing hierarchical device data. It includes details like interface descriptions, metrics, and values in a human-readable format, if MIBs are resolved.
The device IP can be used to generate the SNMP walk using the following command:
snmpwalk -v <SNMP-Version> -c <community-string> <IPAddress-of-simulated-device> <OID-Prefix-value> > <vendor>.<model>.walk
where the <OID-Prefix-value> specifies the starting OID for the walk. If this value is omitted, the walk starts from the root.
Taking these inputs into account, you need to consider the following points in order to get started with the curation process:
-
The type of data being collected
-
The MIB objects that will help in getting the required data
-
The OID or OIDs containing the data being collected, whether these OIDs are in a table or not, and whether they are Counter type values or Gauge type values
-
How you can test if the values are available
-
Whether there is a static instance or a table of instances
-
Whether there is a static maximum or a table of maximums
-
Whether there is a factor to reduce units or not
-
Whether there needs to be a filter on the values stored or not
-
Whether you can use existing metric types or you require new ones to be created
-
Whether there is more than value that overrides the standard support or not
The steps involved in the curation process are:
Step 1: Finding Relevant MIB Objects
To find which MIBs and MIB objects are related to performance metrics, use the following command:
grep -R -i -E "(disc|disk|cpu|memory|store|storage|fan|packet|pkt|byte|octet|temp|psu|supply|battery|voltage|heap|temp|ram|mem|read|write|usage|capacity) OBJECT-TYPE" <path-to-MIB-files>
An example command and output snippet is:
$ grep -R -i -E "(disc|disk|cpu|memory|store|storage|fan|packet|pkt|byte|octet|temp|psu|supply|battery|voltage|heap|temp|ram|mem|read|write|usage|capacity) OBJECT-TYPE" /opt/assure1/ixia
/opt/assure1/ixia/EXMP-COMPA-DEVICE-MIB.mib:deviceHwStatusMemUsageTotalMem OBJECT-TYPE
/opt/assure1/ixia/EXMP-COMPA-DEVICE-MIB.mib:deviceHwStatusMemUsageUsedMem OBJECT-TYPE
/opt/assure1/ixia/EXMP-COMPA-DEVICE-MIB.mib:deviceHwStatusMemUsageFreeMem OBJECT-TYPE
/opt/assure1/ixia/EXMP-COMPA-DEVICE-MIB.mib:deviceCpuUsageUserCpu OBJECT-TYPE
/opt/assure1/ixia/EXMP-COMPA-DEVICE-MIB.mib:deviceCpuUsageSystemCpu OBJECT-TYPE
/opt/assure1/ixia/EXMP-COMPA-DEVICE-MIB.mib:deviceCpuUsageIdleCpu OBJECT-TYPE
/opt/assure1/ixia/EXMP-COMPA-UAP-MODULES-MIB.mib:chassisBatteryAlarmsLowThresholdMinorVoltage OBJECT-TYPE
/opt/assure1/ixia/EXMP-COMPA-UAP-MODULES-MIB.mib:chassisBatteryAlarmsLowThresholdMajorVoltage OBJECT-TYPE
/opt/assure1/ixia/EXMP-COMPA-UAP-MODULES-MIB.mib:chassisBatteryAlarmsHighThresholdMinorVoltage OBJECT-TYPE
/opt/assure1/ixia/EXMP-COMPA-UAP-MODULES-MIB.mib:chassisBatteryAlarmsHighThresholdMajorVoltage OBJECT-TYPE
This command filters only the MIBs and objects that contain one of the metric type strings mentioned in the command. You can add more metric types if required.
Not all objects found using this command relate to performance metrics. A few may be related to fault metrics. For example, in the above result snippet, objects of the type chassisBatteryAlarmsLowThresholdMinorVoltage are related to fault. You need to manually verify this by going through the descriptions of the objects in the MIB file.
From the above output, the objects of interest are:
-
EXMP-COMPA-DEVICE-MIB.mib:deviceHwStatusMemUsageTotalMem
-
EXMP-COMPA-DEVICE-MIB.mib:deviceHwStatusMemUsageUsedMem
-
EXMP-COMPA-DEVICE-MIB.mib:deviceHwStatusMemUsageFreeMem
-
EXMP-COMPA-DEVICE-MIB.mib:deviceCpuUsageUserCpu
-
EXMP-COMPA-DEVICE-MIB.mib:deviceCpuUsageSystemCpu
-
EXMP-COMPA-DEVICE-MIB.mib:deviceCpuUsageIdleCpu
Generally, performance support should be provided for as many metrics as possible. The number of metrics is limited only by the information available in the snmp walk. However, you can look out for just your specifically required performance metrics or MIB objects.
Step 2: Finding OIDs of MIB Objects
To find the OIDs of the required MIB objects, use the following command:
snmptranslate -M <path-to-MIB-files> -m ALL -On <MIB::object> 2> <path-to-error-file>
An example command and output is:
snmptranslate -M /opt/assure1/distrib/mibs -m ALL -On EXMP-COMPA-DEVICE-MIB::deviceHwStatusMemUsageTotalMem 2> /opt/assure1/error_deviceHwStatusMemUsageTotalMem.txt

.1.3.6.1.4.1.3054.100.2.3.1.8.4.1
If you cannot find the OID of a MIB object with this command, check the error file for any errors, resolve these errors, and rerun the command.
Note:
The snmptranslate command refers to all the files present inside the path given to find the OID from an object. Since there are usually a large number of MIB files, it can take a lot of time to execute. For a faster method, you can use the path to a directory having a copy of the dependency MIBs so that each translation does not have to look at the entire MIBs folder. Instead of directly copying the MIBs, symbolic links can be created. For example, if IF-MIB is needed to be in the local dependency MIBs folder, instead of copying it from the MIBs folder, a symbolic link can be created:
mkdir dependency-mibs

ln -s $A1BASEDIR/distrib/mibs/IF-MIB.txt dependency-mibs/

ls -l dependency-mibs/
This creates a link pointing to the original file.
Step 3: Looking for Patterns in Values of OIDs in SNMP Walk
Observe the OIDs of the MIB objects of interest in the example from the previous step. If you search for 100.2.3.1.8.4.1, which is the suffix of the OID .1.3.6.1.4.1.3054.100.2.3.1.8.4.1 of the deviceHwStatusMemUsageTotalMem object, in the walk, you will get a list of entries. The following is a snippet of the list of entries:
SNMPv2-SMI::enterprises.3054.100.2.3.1.8.4.1.0 = Gauge32: 8073652
SNMPv2-SMI::enterprises.3054.100.2.3.1.8.4.2.0 = Gauge32: 567028
SNMPv2-SMI::enterprises.3054.100.2.3.1.8.4.3.0 = Gauge32: 7506624
SNMPv2-SMI::enterprises.3054.100.2.3.1.8.5.1.2.1 = STRING: "cpu"
SNMPv2-SMI::enterprises.3054.100.2.3.1.8.5.1.2.2 = STRING: "cpu0"
SNMPv2-SMI::enterprises.3054.100.2.3.1.8.5.1.2.3 = STRING: "cpu1"
SNMPv2-SMI::enterprises.3054.100.2.3.1.8.5.1.3.1 = STRING: "Overall CPU usage"
SNMPv2-SMI::enterprises.3054.100.2.3.1.8.5.1.3.2 = STRING: "CPU0 usage"
SNMPv2-SMI::enterprises.3054.100.2.3.1.8.5.1.3.3 = STRING: "CPU1 usage"
SNMPv2-SMI::enterprises.3054.100.2.3.1.8.5.1.4.1 = STRING: "1.6"
SNMPv2-SMI::enterprises.3054.100.2.3.1.8.5.1.4.2 = STRING: "2.0"
SNMPv2-SMI::enterprises.3054.100.2.3.1.8.5.1.4.3 = STRING: "6.3"
SNMPv2-SMI::enterprises.3054.100.2.3.1.8.5.1.5.1 = STRING: "1.2"
SNMPv2-SMI::enterprises.3054.100.2.3.1.8.5.1.5.2 = STRING: "1.8"
SNMPv2-SMI::enterprises.3054.100.2.3.1.8.5.1.5.3 = STRING: "3.5"
SNMPv2-SMI::enterprises.3054.100.2.3.1.8.5.1.6.1 = STRING: "96.9"
SNMPv2-SMI::enterprises.3054.100.2.3.1.8.5.1.6.2 = STRING: "95.8"
SNMPv2-SMI::enterprises.3054.100.2.3.1.8.5.1.6.3 = STRING: "89.8"
SNMPv2-SMI::enterprises.3054.100.2.3.1.8.5.1.99.1 = INTEGER: 1
SNMPv2-SMI::enterprises.3054.100.2.3.1.8.5.1.99.2 = INTEGER: 1
SNMPv2-SMI::enterprises.3054.100.2.3.1.8.5.1.99.3 = INTEGER: 1
Note:
When searching in the walk, Oracle recommends using the suffix of the OID because, in many cases, the prefix is replaced with a string value.
In the above list, you can observe the following patterns:
-
There is a sequence of entries for the OID SNMPv2-SMI::enterprises.3054.100.2.3.1.8.4.1 of type Gauge 32. These signify memory metrics. You may also notice that the sum of the values of the second and third entries (567028 and 7506624) is the value of the first entry (8073652). This signifies that the first value relates to total memory, while the second and third value refer to memory used and free memory.
-
There is a long sequence of entries for the OID SNMPv2-SMI::enterprises.3054.100.2.3.1.8.5.1. You may also notice that there are multiple sets of 3 entries each.
Step 4: Taking Information from MIB Objects and SNMP Walk to Curate PCOM
From the example described in the previous steps, you can infer that the PCOM is being curated for memory metrics and CPU metrics. This means that there will be two objects in the PCOM file, with the value of the class field for one being MEMORY, and the class field of the other being CPU. See the class field definition in Object Definitions for more information.
To find the values of the other fields in the PCOM file, you go through the original MIB file to look for the details of objects of interest.
For the fields in the object with the class field value of MEMORY, consider the following snippet from the MIB file:
-- System memory utilization (KB)
-- tagpath /device/hwStatus/memUsage
deviceHwStatusMemUsage OBJECT IDENTIFIER ::= { deviceHwStatus 4 }

-- tagpath /device/hwStatus/memUsage/totalMem
deviceHwStatusMemUsageTotalMem OBJECT-TYPE
    SYNTAX      Unsigned32
    MAX-ACCESS  read-only
    STATUS      current
    DESCRIPTION "Total memory"
    ::= { deviceHwStatusMemUsage 1 }

-- tagpath /device/hwStatus/memUsage/usedMem
deviceHwStatusMemUsageUsedMem OBJECT-TYPE
    SYNTAX      Unsigned32
    MAX-ACCESS  read-only
    STATUS      current
    DESCRIPTION "Used memory"
    ::= { deviceHwStatusMemUsage 2 }

-- tagpath /device/hwStatus/memUsage/freeMem
deviceHwStatusMemUsageFreeMem OBJECT-TYPE
    SYNTAX      Unsigned32
    MAX-ACCESS  read-only
    STATUS      current
    DESCRIPTION "Free memory"
    ::= { deviceHwStatusMemUsage 3 }
From the snippet, you can set the values for the following fields:
-
subClass: USAGE
In the first line, system memory utilization has been assigned an absolute unit in kilobytes, which signifies that the subclass is USAGE. Although the word utilization is present, the subclass cannot be UTILIZATION as the unit is not percentage. See the subClass field definition in Object Definitions for more information.
-
@objectName: EXMP-COMPA-DEVICE-MIB::deviceHwStatusMemUsage
Here, deviceHwStatusMemUsage is the parent node for memory usage information objects. See the @objectName field definition in Object Definitions for more information.
-
snmp.discovery.name: EXMP-COMPA-DEVICE-MIB::deviceHwStatusMemUsage
See the discovery field definition in SNMP Definitions for more information.
-
snmp.factor: 1024
See the factor field definition in SNMP Definitions for more information.
-
snmp.instance: null
See the instance field definition in SNMP Definitions for more information.
-
snmp.maximum.name: EXMP-COMPA-DEVICE-MIB::deviceHwStatusMemUsageTotalMem
The maximum value of either memory used or free memory can never be more than the total memory. See the maximum field definition in SNMP Definitions for more information.
-
values.metricType: Memory Used (for deviceHwStatusMemUsageUsedMem object)/ Memory Free (for deviceHwStatusMemUsageFreeMem object)
See the metricType field definition in Value Definitions for more information.
-
values.valueType: Gauge32
The value type has been set as Gauge32 in the SNMP walk in Step 3. See the valueType field definition in Value Definitions for more information.
-
values.thresholds: Memory High
The Memory Used metric type aligns with the Memory High threshold in Unified Assurance. However, for some older PCOM files, High Mem Major is used instead. This is a deprecated value and should not be used in newer PCOMs. See the thresholds field definition in Value Definitions for more information.
For the fields in the object with the class field value of CPU, consider the following snippet from the MIB file:
-- tagpath /device/hwStatus/cpuUsage
deviceCpuUsageTable OBJECT-TYPE
    SYNTAX      SEQUENCE OF DeviceCpuUsageEntry
    MAX-ACCESS  not-accessible
    STATUS      current
    DESCRIPTION "CPU utilization (%)"
    ::= { deviceHwStatus 5 }

-- tagpath /device/hwStatus/cpuUsage
deviceCpuUsageEntry OBJECT-TYPE
    SYNTAX      DeviceCpuUsageEntry
    MAX-ACCESS  not-accessible
    STATUS      current
    DESCRIPTION ""
    INDEX { deviceCpuUsageIndex }
        ::= { deviceCpuUsageTable 1 }

DeviceCpuUsageEntry ::=
    SEQUENCE {
        deviceCpuUsageIndex Integer32,
        deviceCpuUsageCpuId String,
        deviceCpuUsageDescription String,
        deviceCpuUsageUserCpu ConfdString,
        deviceCpuUsageSystemCpu ConfdString,
        deviceCpuUsageIdleCpu ConfdString
    }

-- tagpath /device/hwStatus/cpuUsage/index
deviceCpuUsageIndex OBJECT-TYPE
    SYNTAX      Integer32 (1 .. 2147483647)
    MAX-ACCESS  not-accessible
    STATUS      current
    DESCRIPTION "Table index; although mandatory, this object is ignored during SNMP CREATE operations.The system will assign its own index which can be determined  by reading the entire table."
    ::= { deviceCpuUsageEntry 1 }

-- tagpath /device/hwStatus/cpuUsage/cpuId
deviceCpuUsageCpuId OBJECT-TYPE
    SYNTAX      String
    MAX-ACCESS  read-only
    STATUS      current
    DESCRIPTION ""
    ::= { deviceCpuUsageEntry 2 }

-- tagpath /device/hwStatus/cpuUsage/description
deviceCpuUsageDescription OBJECT-TYPE
    SYNTAX      String
    MAX-ACCESS  read-only
    STATUS      current
    DESCRIPTION ""
    ::= { deviceCpuUsageEntry 3 }

-- tagpath /device/hwStatus/cpuUsage/userCpu
deviceCpuUsageUserCpu OBJECT-TYPE
    SYNTAX      ConfdString
    MAX-ACCESS  read-only
    STATUS      current
    DESCRIPTION "User CPU utilization"
    ::= { deviceCpuUsageEntry 4 }

-- tagpath /device/hwStatus/cpuUsage/systemCpu
deviceCpuUsageSystemCpu OBJECT-TYPE
    SYNTAX      ConfdString
    MAX-ACCESS  read-only
    STATUS      current
    DESCRIPTION "System CPU utilization"
    ::= { deviceCpuUsageEntry 5 }

-- tagpath /device/hwStatus/cpuUsage/idleCpu
deviceCpuUsageIdleCpu OBJECT-TYPE
    SYNTAX      ConfdString
    MAX-ACCESS  read-only
    STATUS      current
    DESCRIPTION "Idle CPU utilization"
    ::= { deviceCpuUsageEntry 6 }
The CPU objects are presented in a different manner to the memory objects, as seen above. This is because the MIB objects related to CPU metrics are a part of a table rather than individual objects.
The data in MIB files can be categorized in three formats:
-
Table: This is a collection of related object types organized in rows and columns.
-
Object Type: This defines a single manageable data point, including its OID, syntax, access permissions, and description.
-
Sequence: This defines the structure of a table entry, listing the object types (columns) that make up a single row.
To visualize the information from the CPU objects, along with the information from the SNMP walk, the data can be presented in a table as follows:
Table Object Name (with OID): deviceCpuUsageTable (.3054.100.2.3.1.8.5)
Table Entry Type Object (with OID of one instance): deviceCpuUsageEntry (.3054.100.2.3.1.8.5.1)
| deviceCpuUsageIndex (.3054.100.2.3.1.8.5.1.1) | deviceCpuUsageCpuId (.3054.100.2.3.1.8.5.1.2) | deviceCpuUsageDescription (.3054.100.2.3.1.8.5.1.3) | deviceCpuUsageUserCpu (.3054.100.2.3.1.8.5.1.4) | deviceCpuUsageSystemCpu (.3054.100.2.3.1.8.5.1.5) | deviceCpuUsageIdleCpu (.3054.100.2.3.1.8.5.1.6) |
|---|---|---|---|---|---|
| 1 | cpu (.3054.100.2.3.1.8.5.1.2.1) | Overall CPU usage (.3054.100.2.3.1.8.5.1.3.1) | 1.6 (.3054.100.2.3.1.8.5.1.4.1) | 1.2 (.3054.100.2.3.1.8.5.1.5.1) | 96.9 (.3054.100.2.3.1.8.5.1.6.1) |
| 2 | cpu0 (.3054.100.2.3.1.8.5.1.2.2) | CPU0 Usage (.3054.100.2.3.1.8.5.1.3.2) | 2.0 (.3054.100.2.3.1.8.5.1.4.2) | 1.8 (.3054.100.2.3.1.8.5.1.5.2) | 95.8 (.3054.100.2.3.1.8.5.1.6.2) |
| 3 | cpu1 (.3054.100.2.3.1.8.5.1.2.3) | CPU1 Usage (.3054.100.2.3.1.8.5.1.3.3) | 6.3 (.3054.100.2.3.1.8.5.1.4.3) | 3.5 (.3054.100.2.3.1.8.5.1.5.3) | 89.8 (.3054.100.2.3.1.8.5.1.6.3) |
From the table, you can set the values for the following fields:
-
@objectName: EXMP-COMPA-DEVICE-MIB::deviceCpuUsageTable
This value is the same as the table object name. See the @objectName field definition in Object Definitions for more information.
-
snmp.discovery.name: EXMP-COMPA-DEVICE-MIB::deviceCpuUsageEntry
Here, you can use the table entry type object or table index type object, if either are present, to set the value. If these two are not present, you can reuse the table object name. See the discovery field definition in SNMP Definitions for more information.
From the code snippet, you can set the values for the following fields:
-
subClass: UTILIZATION
In the first description, it is mentioned that the CPU utilization values are in percentage. See the subClass field definition in Object Definitions for more information.
-
snmp.filter: null
There are no entries that need to be eliminated. See the filter field definition in SNMP Definitions for more information.
-
snmp.factor: null
The values in the SNMP walk are already in percentage, meaning there is no need for any change in value. See the factor field definition in SNMP Definitions for more information.
-
snmp.maximum: 100
Since the unit of this object is percentage, the maximum value is 100. See the maximum field definition in SNMP Definitions for more information.
-
values.metricType: See the following snippet from the PCOM.
"values": [
    {
        "metricType": null,
        "name": "EXMP-COMPA-DEVICE-MIB::deviceCpuUsageUserCpu",
        "oid": "1.3.6.1.4.1.3054.100.2.3.1.8.5.1.4",
        "valueType": "OCTET STRING"
    },
    {
        "metricType": null,
        "name": "EXMP-COMPA-DEVICE-MIB::deviceCpuUsageSystemCpu",
        "oid": "1.3.6.1.4.1.3054.100.2.3.1.8.5.1.5",
        "valueType": "OCTET STRING"
    },
    {
        "metricType": "CPU Utilization",
        "eval": "$deviceCpuUsageUserCpu[$i] + $deviceCpuUsageSystemCpu[$i]"
    }
]
Here, deviceCpuUsageUserCpu and deviceCpuUsageSystemCpu are not required to be displayed on the UI, so their metricType fields are set as null. However, the third element in the values array, having a value equal to the sum of deviceCpuUsageUserCpu and deviceCpuUsageSystemCpu, is to be displayed on the UI. For this, it needs a value to be set for the metricType field. This metricType value is the name of one of the various metric types supported within Unified Assurance, with which the data collected is aligned. In this case, it is CPU Utilization. See the metricType field definition in Value Definitions for more information.
Note:
There are some cases where different instances have different metric types or get their information from different MIB objects, but belong to the same class and subclass. In such cases, you can add these separate instances within the same object, as separate elements in the values array. You do not have to create a separate object in the PCOM for each instance.
Testing Curated PCOM
There are two ways of testing the curated PCOM:
-
Using SOA applications. See Testing Using SOA Applications.
-
Using microservices. See Testing Using Microservice.
Testing Using SOA Applications
To test the curated PCOM file using SOA applications:
-
Identify the required devices, whether they are standard (vendor-specific) or basic (IETF), and get their IP addresses.
-
Discover the devices by first running the Device Auto Discovery (Ping Discovery) job, and then running the Device SNMP Discovery job:
-
To discover the devices by running the Device Auto Discovery (Ping Discovery) job:
-
In the Unified Assurance UI, go to the Jobs UI.
From the Configuration menu, select Broker Control, then Jobs. See Jobs in Unified Assurance User's Guide for more information on this UI.
-
Clone the Device Auto Discovery job.
-
Modify the cloned Device Auto Discovery - Copy job by setting LogLevel to DEBUG and Status to Enabled, and click Submit.
-
Go to the Inclusion Profiles UI.
From the Configuration menu, select Device Discovery, then Inclusion Profiles. See Inclusion Profiles in Unified Assurance User's Guide for more information on this UI.
-
Click Add and, from the dropdown list, click Ping Inclusion Profile.
-
In the form that shows up, enter the required values in the Name and IP Address Regex Range fields, set the CIDR field to Disabled, and click Submit.
-
Go back to the Jobs UI and start the Device Auto Discovery - Copy job. If the job is already in Running state, restart the service.
-
Go to the Devices UI.
From the Configuration menu, select Device Catalog, then Devices. See Devices in Unified Assurance User's Guide for more information on this UI.
-
Review the devices that have been discovered.
All initially discovered devices appear in the Devices UI with Verified state.
-
-
To discover the devices by running the Device SNMP Discovery job:
-
In the Unified Assurance UI, go to the Jobs UI.
From the Configuration menu, select Broker Control, then Jobs. See Jobs in Unified Assurance User's Guide for more information on this UI.
-
Clone the Device SNMP Discovery job.
-
Modify the cloned Device SNMP Discovery - Copy job by setting LogLevel to DEBUG and Status to Enabled, and click Submit.
-
Go to the SNMP Access UI.
From the Configuration menu, select Device Discovery, then SNMP Access. See SNMP Access in Unified Assurance User's Guide for more information on this UI.
-
Click Add.
-
In the form that shows up, set the values for SNMP Version, Profile Name, Priority Order, and Community String fields, and click Submit.
-
Go back to the Jobs UI and start the Device SNMP Discovery - Copy job.
-
Go to the Devices UI.
From the Configuration menu, select Device Catalog, then Devices. See Devices in Unified Assurance User's Guide for more information on this UI.
-
Review the devices that have been discovered.
All SNMP discovered devices appear in the Devices UI with Discovered state.
-
-
-
If you are testing using the Metric Generic SNMP Poller, generate the foundation rules from the curated PCOM file:
-
From the command line of your testing server, install the sdk-lib package as root user, if it is not installed already:
sudo su ls $A1BASEDIR/bin source $A1BASEDIR/.bashrc $A1BASEDIR/bin/Package install sdk-lib -
Switch to assure1 user:
su assure1 -
Run the PCOM2Rules tool, making sure to enter the correct paths to the PCOM file and foundation rules file as inout and output respectively. These paths must be within the assure1 directory or a sub-directory of assure1.
$A1BASEDIR/bin/sdk/PCOM2Rules <path to PCOM file>/<filename> >> <path for .foundationrules file>/<filename> -
Navigate the path to the foundation file to view the generated output file:
cat <path for .foundationrules file>
-
-
Add the foundation rules file into the testing server:
-
In the Unified Assurance UI, go to the Rules UI.
From the Configuration menu, select Rules. See Rules in Unified Assurance User's Guide for more information on this UI.
-
Expand the following folders:
Core Rules (core)/Default read-write branch (default)/collection/metric/snmp/_vendor
-
Click Add, then Add File.
-
In the Rule (new) window, paste the foundation rules file generated using the PCOM2Rules tool, enter a name for the file in the File Name field, and click Submit.
-
-
Create a poller template with the specified metric type used in the PCOM file:
-
In the Unified Assurance UI, go to the Poller Templates UI.
From the Configuration menu, select Metrics, then Poller Templates. See Poller Templates in Unified Assurance User's Guide for more information on this UI.
-
Click Add.
-
In the Poller Template (new) menu, enter a name for the template in the Name field, select the required metric types, and click Submit.
-
-
Create a threshold group with the specified thresholds used in the PCOM file:
-
In the Unified Assurance UI, go to the Threshold Groups UI.
From the Configuration menu, select Metrics, then Thresholds, then Threshold Groups. See Threshold Groups in Unified Assurance User's Guide for more information on this UI.
-
Click Add.
-
In the Threshold Group (new) window, enter a name for the threshold group in the Name field, select the required thresholds, and click Submit.
-
-
Create a polling assignment using the poller template and threshold group created in steps 5 and 6:
-
In the Unified Assurance UI, go to the Polling Assignments UI.
From the Configuration menu, select Metrics, then Polling Assignments. See Polling Assignments in Unified Assurance User's Guide for more information on this UI.
-
In the Crud Form, enter the following details:
-
Method: SNMP
-
Poller Template: The name of the poller template created in step 5.
-
Threshold Group: The name of the threshold group created in step 6.
-
Poll Time: 300
-
-
From the Devices list, select the ones that were discovered and click Submit.
-
-
In the Unified Assurance UI, navigate to the Services UI.
From the Configuration menu, select Broker Control, then Services. See Services in Unified Assurance User's Guide for more information on this UI.
-
Select the Metric Generic SNMP Poller and click Restart.
-
In the Unified Assurance UI, navigate to Devices. Click on the Metrics icon for the required discovered device.
The Metrics Overview window appears.
-
Verify the metrics that appear in the Metrics Overview window.
Testing Using Microservices
To test the curated PCOM file using microservices:
-
Identify the required devices, whether they are standard (vendor-specific) or basic (IETF), and get their IP addresses.
-
Discover the devices:
-
From the command line of your testing server, as the assure1 user, set up the required environment variables and install the microservices required for discovery:
export NAMESPACE=a1-zone1-pri export WEBFQDN=`hostname -f` a1helm install snmp-poller assure1/snmp-poller -n $NAMESPACE --set global.imageRegistry=$WEBFQDN --set configData.LOG_LEVEL=DEBUG a1helm install discovery-service assure1/discovery-service -n $NAMESPACE --set global.imageRegistry=$WEBFQDN --set configData.LOG_LEVEL=DEBUG a1helm install dom-processor assure1/dom-processor -n $NAMESPACE --set global.imageRegistry=$WEBFQDN --set configData.LOG_LEVEL=DEBUG a1helm install graph-sink assure1/graph-sink -n $NAMESPACE --set global.imageRegistry=$WEBFQDN --set configData.LOG_LEVEL=DEBUG a1helm install ping-poller assure1/ping-poller -n $NAMESPACE --set global.imageRegistry=$WEBFQDN --set configData.LOG_LEVEL=DEBUG -
Verify that the installed microservices are running properly:
a1k get pods -n a1-zone1-pri -
Create the JWT token for authorization:
$A1BASEDIR/bin/JWT -a discovery-service -s assure1 -
Create a JSON file called <vendor>-discovery-payload.json, where <vendor> is the name of the vendor. For example, ixia. See Example Payload File for an example file.
-
Send a POST request to the Create a Discovery Job endpoint, passing <vendor>-discovery-payload.json as the request body by specifying it in the -d option:
curl -X POST -H "Authorization: Bearer <JWT_token>" -d @<vendor>-discovery-payload.json https://<collection server url>:9443/discovery-service/discovery/request/create/In the request response, look for the value of DiscoveryContextID and copy it.
-
To check the status of the POST request, submit the following GET request:
curl -X GET -H "Authorization: Bearer <JWT_token>" https://<collection server url>:9443/discovery-service/discovery/request/statusWhen the value of the SNMPStatus attribute is Completed, the discovery request is done.
-
Submit the following GET request:
curl -X GET -H "Authorization: Bearer <JWT_token>" https://<collection server url>:9443/discovery-service/discovery/request/result/<discovery-context-id>?where <discovery-context-id> is the context ID you copied from the POST request response earlier.
-
Send a POST request to the translate endpoint, passing the SNMP response from the previous step as the request body by specifying it in the -d option:
curl -X POST -H "Authorization: Bearer <JWT_token>" -d @<SNMP_response> https://<collection server url>:9443/discovery-service/inventory/translate/ -
To add the SNMP devices to the Unified Assurance database, send a POST request to the inventory endpoint, passing the formatted SNMP response from the previous step as the request body by specifying it in the -d option:
curl -X POST -H "Authorization: Bearer <JWT_token>" -d @<formatted_SNMP_response> https://<collection server url>:9443/discovery-service/inventory/ -
Verify that the target tables in the Unified Assurance database have been populated with the required device data:
select * from Devices; select * from DeviceObjects; -
In the Unified Assurance UI, go to the Devices UI.
From the Configuration menu, select Device Catalog, then Devices. See Devices in Unified Assurance User's Guide for more information on this UI.
-
Verify that the target device is in Discovered state.
-
-
Add the curated PCOM file into the testing server:
-
In the Unified Assurance UI, go to the Rules UI.
From the Configuration menu, select Rules. See Rules in Unified Assurance User's Guide for more information on this UI.
-
Expand the following folders:
Core Rules (core)/Default read-write branch (default)/collection/metric/snmp/_objects/pcom
-
Click Add, then click Add File.
-
In the Rule (new) window, paste the curated PCOM file content, give the file a name, and click Submit.
-
-
From the command line of your testing server, as the assure1 user, install the Metric Sink microservice using the following command:
export NAMESPACE=a1-zone1-pri
export WEBFQDN=`hostname -f`
a1helm install metric-sink assure1/metric-sink -n $NAMESPACE --set global.imageRegistry=$WEBFQDN --set configData.LOG_LEVEL=DEBUG
See Metric Sink in Unified Assurance Implementation Guide for more information on this microservice.
-
Uninstall the SNMP Poller microservice using the following command:
export NAMESPACE=a1-zone1-pri
export WEBFQDN=`hostname -f`
a1helm uninstall snmp-poller -n $NAMESPACE
See SNMP Poller in Unified Assurance Implementation Guide for more information on this microservice.
-
Reinstall the SNMP Poller microservice using the following command:
a1helm install snmp-poller assure1/snmp-poller -n $NAMESPACE --set global.imageRegistry=$WEBFQDN --set configData.LOG_LEVEL=DEBUG -
Scale up the worker pods of the SNMP Poller microservice to get a pod for polling:
a1k scale --replicas=2 sts snmp-poller-worker -n $NAMESPACE -
In the Unified Assurance UI, navigate to Devices. Click on the Metrics icon for the required discovered device.
The Metrics Overview window appears.
-
Verify the metrics that appear in the Metrics Overview window.
Example Payload File
The following is the ixia-discovery-payload.json file:
{
    "Type": "Discovery",
    "Version": "1.0.0",
    "Data": {
        "Configuration": {
            "ForcedProtocolDiscovery": false,
            "ContextExpiryTimeM": 60,
            "ICMPConfiguration": [
                {
                    "Mode": 1,
                    "TimeoutS": 1,
                    "Count": 4,
                    "CascadeMs": 10
                }
            ],
            "SNMPConfiguration": [
                {
                    "ProbeV2Support": true,
                    "NetworkOptions": {
                        "Timeout": "1s",
                        "ExpotentialTimeout": "true",
                        "Retries": 2,
                        "MaxOids": 64,
                        "MaxRepetition": 10,
                        "NonRepeaters": 0
                    },
                    "CustomSNMPAccessProfiles": [
                        {
                            "Version": 2,
                            "Priority": 0,
                            "Port": 161,
                            "MTU": 1456,
                            "Auth": {
                                "Community": "public"
                            }
                        }
                    ]
                }
            ],
            "RESTConfiguration": [],
            "SOAPConfiguration": []
        },
        "Seeds": [],
        "IPranges": [],
        "IPList": ["172.16.21.22"],
        "Level": [
            1,
            2
        ],
        "InventoryEngine": "insomnia-client"
    }
}
Analyzing the SNMP Poller Logs
To analyze the logs when testing using the Metric Generic SNMP Poller, open the log file at $A1BASEDIR/logs/MetricGenericSNMPPoller.log. This is the default location of the log file. If you have specified a different location and need to find the correct file path, do the following:
-
In the Unified Assurance UI, go to the Services UI.
From the Configuration menu, select Broker Control, then Services. See Services in Unified Assurance User's Guide for more information on this UI.
-
Select the Metric Generic SNMP Poller.
-
In the Configuration section of the Service (edit) pane that pops up, check the value of the LogFile field. This will show the path of the poller log files in the Unified Assurance directory.
-
In the command line of the Unified Assurance server, open the $A1BASEDIR/<path_from_previous_step> file.
To analyze the logs when testing using the SNMP Poller microservice, check the logs of the polling worker using the following command:
a1k logs snmp-poller-worker-1 -n a1-zone1-pri
In the log file, check for the combination of <class_subclass_weight> for your required metric. For example, for the CPU UTILIZATION metric, you may see CPU_UTILIZATION_2, which means that CPU is the class, UTILIZATION is the subclass, and 2 is the weight. You can check these values for all types of metrics, with different classes and subclasses, to understand how the values of each metric are showing up in the UI.
Useful Resources
-
UIM SNMP Data Monitoring Device Support: An online repository of supported vendors, devices, metrics, MIBs and utilities for the Unified Assurance product. See Unified Assurance Device Support Overview for more information.
-
Circitor MIB files repository: A MIB repository which provides a handy break-down of the objects in a MIB and displays both the symbolic name and the full OID of the object.
-
Desktop Free Mib Browser