Understanding Observability Analytics
Learn about how to install, maintain, and interact with Oracle Communications Unified Assurance Observability Analytics. This document describes architecture, integration with Unified Assurance, installation, scaling, backup and restore strategy, and supported automations for Observability Analytics. It is intended for trained Unified Assurance administrators and consultants to plan, run, and support an Observability Analytics deployment.
About Observability Analytics
Observability Analytics provides dashboards that help you quickly and easily navigate historical data to determine root causes and document historical events. It also provides a machine learning feedback loop to take data, process it, analyze it, and alert back into the real-time fault engine for event correlation. The various anomaly detectors let you automatically leverage historical data to spot event anomalies in real time and inject them as root cause events into Unified Assurance. Unified Assurance can then detect and suppress noise based on the root cause events.
Observability Analytics provides:
-
Faster history analysis.
-
A system that automatically learns from history.
-
Visibility into root cause anomalies that let the network operations center (NOC) focus on actionable events.
-
Noise suppression, hiding distractions from the NOC.
Observability Analytics Architecture
Observability Analytics functionality involves the three architectural layers of Unified Assurance:
-
Collection layer: Collectors receive faults in real-time from external devices and from anomalies identified by Observability Analytics, based on the real-time events.
-
Database layer: Faults are stored as events in the Event database and streamed to the Historical database.
-
Presentation layer: Users interact with the event list, derived from the Event database. They access Observability Analytics dashboards directly or from context menu tools in the event list.
The following figure illustrates the workflow across the architectural layers:
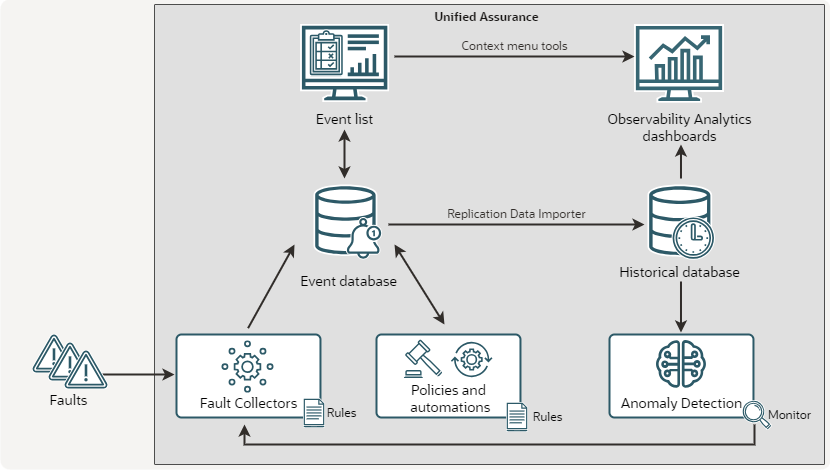
Description of illustration observability-analytics-architecture-diagram.png
As shown in the figure, the Observability Analytics workflow is:
-
Devices and systems send faults into the collection servers, where they are processed through rules and normalized.
-
Events are stored in the real-time Event database.
-
The MySQL Replication Data Importer service takes data from all new and updated events and new journal entries and copies it to the Historical database.
-
Anomaly Detection analyzes the historical data and identifies anomalies.
-
Alerting monitors send anomalies to the Event WebHook Aggregator.
-
The Event WebHook Aggregator creates new events for the detected anomalies.
-
Policies in Custom Action Policy Engine (CAPE) process the anomalies to correlate, enrich, and suppress events.
-
Users interact with the event list in the Unified Assurance UI. They can manually adjust events, for example, to change severity, delete them, acknowledge them, and so on.
-
Users access historical events in the Observability Analytics dashboards inside the Unified Assurance UI either by opening the dashboards directly, or by selecting context menu tools in the real-time event list.
Key Observability Analytics Components
Observability Analytics is made up of the following key components:
-
Historical database: Stores all historical events and event journals for a period of time defined for the index. It runs anomaly detectors and sends notifications about anomalies. The Historical database is an OpenSearch cluster. For information about scalability and redundancy, as well as an architecture diagram, see Historical Database Scalability and Redundancy.
-
OpenSearch Dashboards: Show data from the Historical database in graphical formats on Unified Assurance presentation servers. You can access the dashboards and related UIs from the main navigation by selecting Analytics, then Events, and then Dashboards.
Tip:
You can use the OpenSearch Dev Tools console within the Unified Assurance UI to run API calls without worrying about authentication or writing custom scripts. See Running queries in the Dev Tools console in the OpenSearch documentation for more information.
-
MySQL Replication Data Importer: Loads events and journals from the Event database into the Historical database. It reads from MySQL binary logs and inserts changes into OpenSearch. The AnalyticsWizard service runs it automatically.
See MySQL Replication Data Importer and AnalyticsWizard in Unified Assurance Implementation Guide for information about these services.
-
Event WebHook Aggregator: Listens for data posted from OpenSearch anomaly monitors and processes the data as a possible real-time fault. This is included as part of the Collection.Core role.
See WebHookd in Unified Assurance Implementation Guide for information about this application.
-
Custom Action Policy Engine (CAPE): Listens for specific events based on filters and runs custom actions. Observability Analytics leverages CAPE to run automations on anomalies as they are detected in real-time.
See CustomPolicyEngined in Unified Assurance Implementation Guide for information about this application.
Installing and Configuring Observability Analytics
You install and configure Observability Analytics by running AnalyticsWizard as part of the Unified Assurance installation process. See Overview in Unified Assurance Installation Guide for information about the different Unified Assurance installation configurations.
Post Install Actions
After installing Unified Assurance and running AnalyticsWizard, perform the following steps to enable Observability Analytics:
-
Enable the Event WebHook Aggregator on the collection servers.
On redundant systems, enable the primary WebHook Aggregator on the primary collection server and enable a redundant WebHook Aggregator on the redundant collection server.
See Services in Unified Assurance User's Guide for information about the UI for enabling services.
-
Configure the Webhook URL in the OpenSearch notification channels with the correct host:
-
From the Analytics menu, select Events, then Administration, and then Management.
-
Click Notifications.
-
Do the following for the assure1_notification and log_watcher channels:
-
Select the channel.
-
From the Actions menu, select Edit.
-
Replace localhost in Webhook URL with the actual Unified Assurance host FQDN.
-
Click Save.
-
-
-
Enable the default CAPE functionality:
-
Enable the following default CAPE nodes:
-
EscalateByAnomaly
-
NotifyByAnomaly
-
SuppressByAnomaly
See Nodes in Unified Assurance User's Guide for information about the UI for enabling CAPE nodes.
See Unified Assurance Automation Policies for Anomaly Detection for information about what these nodes do.
-
-
Enable the following default CAPE policies:
-
AbnormalActivity (runs the EscalateByAnomaly node)
-
FaultStormDips (runs the SuppressByAnomaly node)
-
OperationPerformance (runs the NotifyByAnomaly node)
See Policies in Unified Assurance User's Guide for information about the UI for enabling CAPE policies.
-
-
Enable the Custom Action Policy Engine service.
See Services in Unified Assurance User's Guide for information about the UI for enabling services.
-
-
Start the anomaly detectors applicable to your environment and use cases. When you start anomaly detectors, they begin training the machine learning model on your indexes. You can run them on a range of historical data to train the model initially, and then set them to run continuously.
To run anomaly detectors on historical data:
-
From the main navigation menu, select Analytics, then Events, then Home.
-
From the OpenSearch menu, under OpenSearch Plugins, select Anomaly Detection.
-
From the list on the left, select Detectors.
-
Click a detector.
-
Select the Historical analysis tab.
-
Click Run historical analysis.
-
Select a time range. Oracle recommends a range of at least two months.
-
Click Run historical analysis.
After the model has trained on the historical data, you can start the detectors to run on live data by clicking Start detector on the Real-time results tab.
See Anomaly Detection for Observability Analytics for information about the different anomaly detectors.
-
Scaling Observability Analytics
To prepare and plan for the environment before installation, Oracle recommends running a scale calculator that includes the following considerations:
-
Ingestion: Each node should be able to handle up to 2500 events per second per node. Additional nodes can scale this linearly.
-
Sizing calculations:
-
1GB data space for each 1M rows of data (start with 20GB)
-
1GB memory for each 5 anomaly detectors running (start with 4GB)
-
1 vCPU/core for each 10 anomaly detectors running (start with 2 vCPU)
-
IO: RAID10/3600 IOPS or better
-
-
Standard hardware Recommendations:
-
4 vCPU (up to 20 anomaly detectors)
-
8GB RAM (up to 20 anomaly detectors)
-
100GB Disk (up to 60M fault records analyzed)
-
Backing Up and Restoring Observability Analytics Data
Oracle recommends that you back up all data and configurations regularly. Backups need to be available, secure, and easily used for restoration. You can use OpenSearch snapshots to back up and restore the Observability Analytics data, and you can automate snapshots with OpenSearch Snapshot management.
See Backing Up and Restoring an OpenSearch Database and Snapshots in the OpenSearch documentation for more information.
Anomaly Detection for Observability Analytics
Observability Analytics includes anomaly detectors for the following areas:
-
Abnormal activity: Detect abnormal activity, including, for example, events occurring at an abnormal physical location, an abnormally high number of times, for an abnormal device, or involving an abnormal interface for a device.
-
Event storms and dips: Detect unusual spikes and dips from component, customer, device, and physical location perspectives, as well as measuring ticket count over time.
To see the anomaly detectors and dashboards:
-
From the main navigation menu, select Analytics, then Events, then Home.
-
From the OpenSearch menu, under OpenSearch Plugins, select Anomaly Detection.
-
Do one of the following:
-
To see the anomaly dashboards, select Dashboard.
See Step 5: Observing the results in the OpenSearch anomaly detection documentation for information about interacting with anomaly dashboards.
-
To see the list of anomaly detectors, select Detectors.
You can filter the list by entering text in the Search bar. For example, to see only abnormal activity detectors, enter abnact.
-
Unified Assurance Automation Policies for Anomaly Detection
Observability Analytics uses alerting monitors to add the anomalies it detects as new real-time events in the Event database. You can use the CAPE service and default nodes and policies to automatically perform encapsulation, correlation, escalation, and notification for the new events.
Observability Analytics uses the following default CAPE nodes:
-
SuppressByAnomaly correlates events with root causes by:
-
Parsing the timestamp and influencers from the anomaly.
-
Finding events in the real-time database that are impacted by the anomaly.
-
Suppressing all events found and annotating them with the root cause (the EventID of anomaly event).
-
-
EscalateByAnomaly increases event severity by:
-
Parsing the timestamp and influencers from the anomaly.
-
Finding events in the real-time database that are impacted by the anomaly.
-
Escalating all events found and annotating them with the root cause. The new severity is indicated by the anomaly event field, as set in WebHook Aggregator rules.
-
-
NotifyByAnomaly sends a notification about anomalies by:
-
Parsing the email addresses to notify from the anomaly.
-
Sending the email by SMTP notification.
-
Clearing the anomaly and adding a journal entry indicating that a notification was sent.
-