What is Vision?
Vision is a geographic mapping application within Oracle Communications Unified Assurance. Vision shows you a real-time map that integrates network data, such as network faults, events, and service impacts, with external data, such as weather information. This gives you a holistic, visual understanding of network status and helps you quickly identify root causes.
The following figure shows an example of the Vision map.
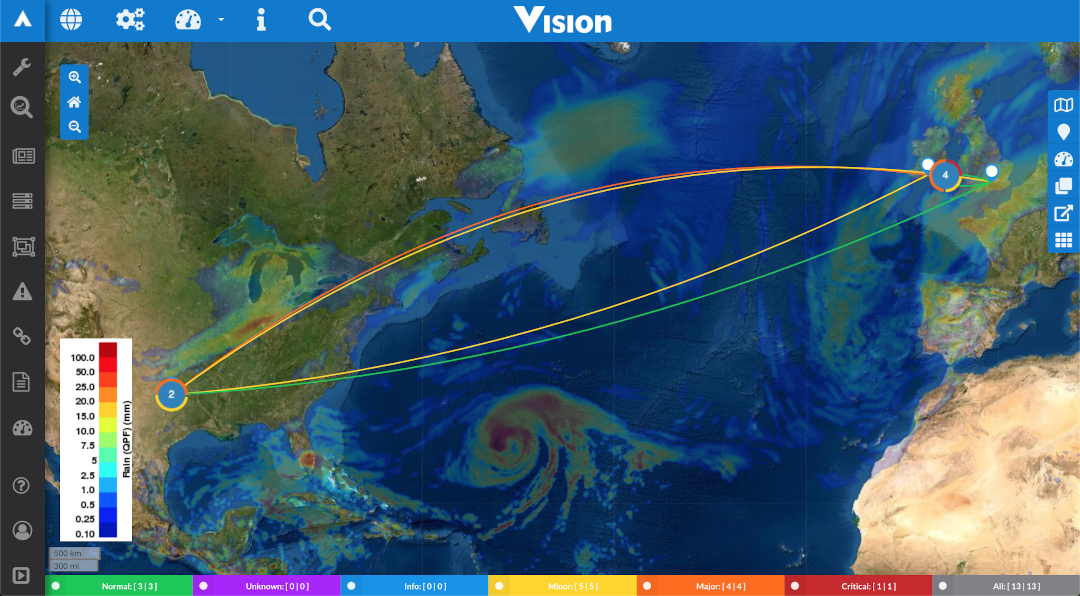
Description of illustration vision-overview.png
About Events in Vision
Vision streams events from Unified Assurance and processes them using event producer, event consumer, and event enrichment applications. Unified Assurance pushes event data onto a stream, where Vision reads and processes it. When coordinates and weather data are available, Vision adds this data to events in Unified Assurance.
When Vision has an entity in its database that matches a Unified Assurance event, the event appears on the Vision map. The color of the event marker corresponds to the event severity and acknowledgment status. The map is updated every minute to display events in real time.
You can filter event layers by severity to show only events of the selected severity on the map. You can select one, several, or all severities to display on the map.
The Vision event is based on the highest severity and lowest acknowledgment across all event sources for that layer and entity combination. For compatible event sources, you can see all events matching that layer and entity combination in the event source in the event pop-up.
Vision has four different types of map elements:
-
Point: Adds a marker to the map.
-
dDevice: Related to a device. Adds a marker and impacts dashboard links that start or end on the affected entity.
-
dLink: Related to an interface on a device. Adds a marker and impacts dashboard links that start or end on the interface.
-
pLink: Related to events for links between two sites rather than the entity or device on either end.
About Additional Vision Map Features
In addition to events, Vision can show the following on the map:
-
Dashboards: Geographical and logical (image-based) dashboards display links between interfaces on entities and the links are colored based on events within Unified Assurance.
-
Weather: Current weather at each event marker, and overlays such as rain radar, using information from OpenWeatherMaps. Helps visually correlate weather patterns with network faults.
-
Overlays: You can add custom overlays from map tiles or packages. For example, packages containing point data can produce markers on the map or image overlays.
-
Custom non-event driven data: Use the Custom Layer Interface to add custom data such as information from social media feeds, property information, or engineer tracking information. The interface reads a specifically-formatted JSON at predetermined intervals, giving each location listed in the JSON a pop-up where custom content appears.
You can use the Vision search bar to search event layers and custom layers for markers and links by name, address, or IP address.
You can use different types of base map, for example satellite, national geographic, or black and white maps. See Adding a Map in Unified Assurance User's Guide for information about how to add a base map.
About Configuring Vision
You configure the elements that appear in Vision by using settings within Vision and in the main Unified Assurance Configuration menu.
-
To configure custom menus and tools: From the navigation menu, select Configuration, then Vision, then either Menus or Tools.
-
To configure everything else, such as maps, layers, and dashboards: From the navigation menu, select Analytics, then Vision, then Configuration.
See Navigating Vision in Unified Assurance User's Guide for more information about navigating and configuring Vision.