4 Searching for Topology Graphs
This chapter describes how to search for topology graphs and customize the search.
Searching for a Topology Graph
To search for a topology graph:
-
On the ATA home page, click the
 icon on the top-left corner.
This opens the Topology Graphs search pane with a list of topology graphs that you have saved (if any). These topology graph records show the corresponding names, descriptions, and the number of nodes. See "Customizing a Topology Graph Search" for more information.
-
(Optional) Type the name or description of a topology graph in the Search field.
A list of related search results appears.
-
Choose a topology graph and click on it or select Render Map in the ellipsis options.
-
(Optional) Select Edit or Discard to edit or discard the topology graph search.
-
(Optional) Click Create New to customize a new topology graph search.
A Create New pane appears. See "Customizing a Topology Graph Search" for more information.
Customizing a Topology Graph Search
You can customize your topology graph search in the Create New search pane. You can use this customized topology graph search for quickly accessing and monitoring the topology graph without selecting the attributes every time.
To customize your topology graph search:
-
Enter a name and a description for the topology graph.
Note:
Name is mandatory for Save & Search. -
In the Attributes side pane, click the '=' icon of an entity to drag and drop the corresponding attributes to the topology graph. See "Selecting Attributes while Customizing a Topology Graph Search" for more information on the list of supported entities and the corresponding attributes.
-
You can add attributes using the following options:
- To add a specific attribute within an entity, expand the entity and drag and drop the specific attribute to the list.
- To add a specific attribute to the list, click the '+ ' icon of the required attribute. You can add all attributes within an entity to the list.
Note:
- If you add a specific attribute to the list, the corresponding entity gets added to the list.
- You can add multiple attributes associated with the entity that is already added to the list.
- If you have added an attribute of an entity, you cannot add another attribute from another entity.
-
(Optional) To add an attribute from another entity, remove the existing attribute or attributes from the list and then add the required attribute from another entity.
-
To remove an attribute or entity, click the Remove icon from the list of added attributes.
Note:
Removing an entity removes all corresponding attributes from the list. -
After you add all attributes, click Save & Search.
The customized topology graph search is saved and the corresponding topology graph appears. All users can use this customized search from the list of saved searches for quickly accessing it.
-
(Optional) Click Search to open the topology graph without saving the search.
The topology graph that contains all the selected attributes appears.
-
(Optional) Click Cancel to cancel the search.
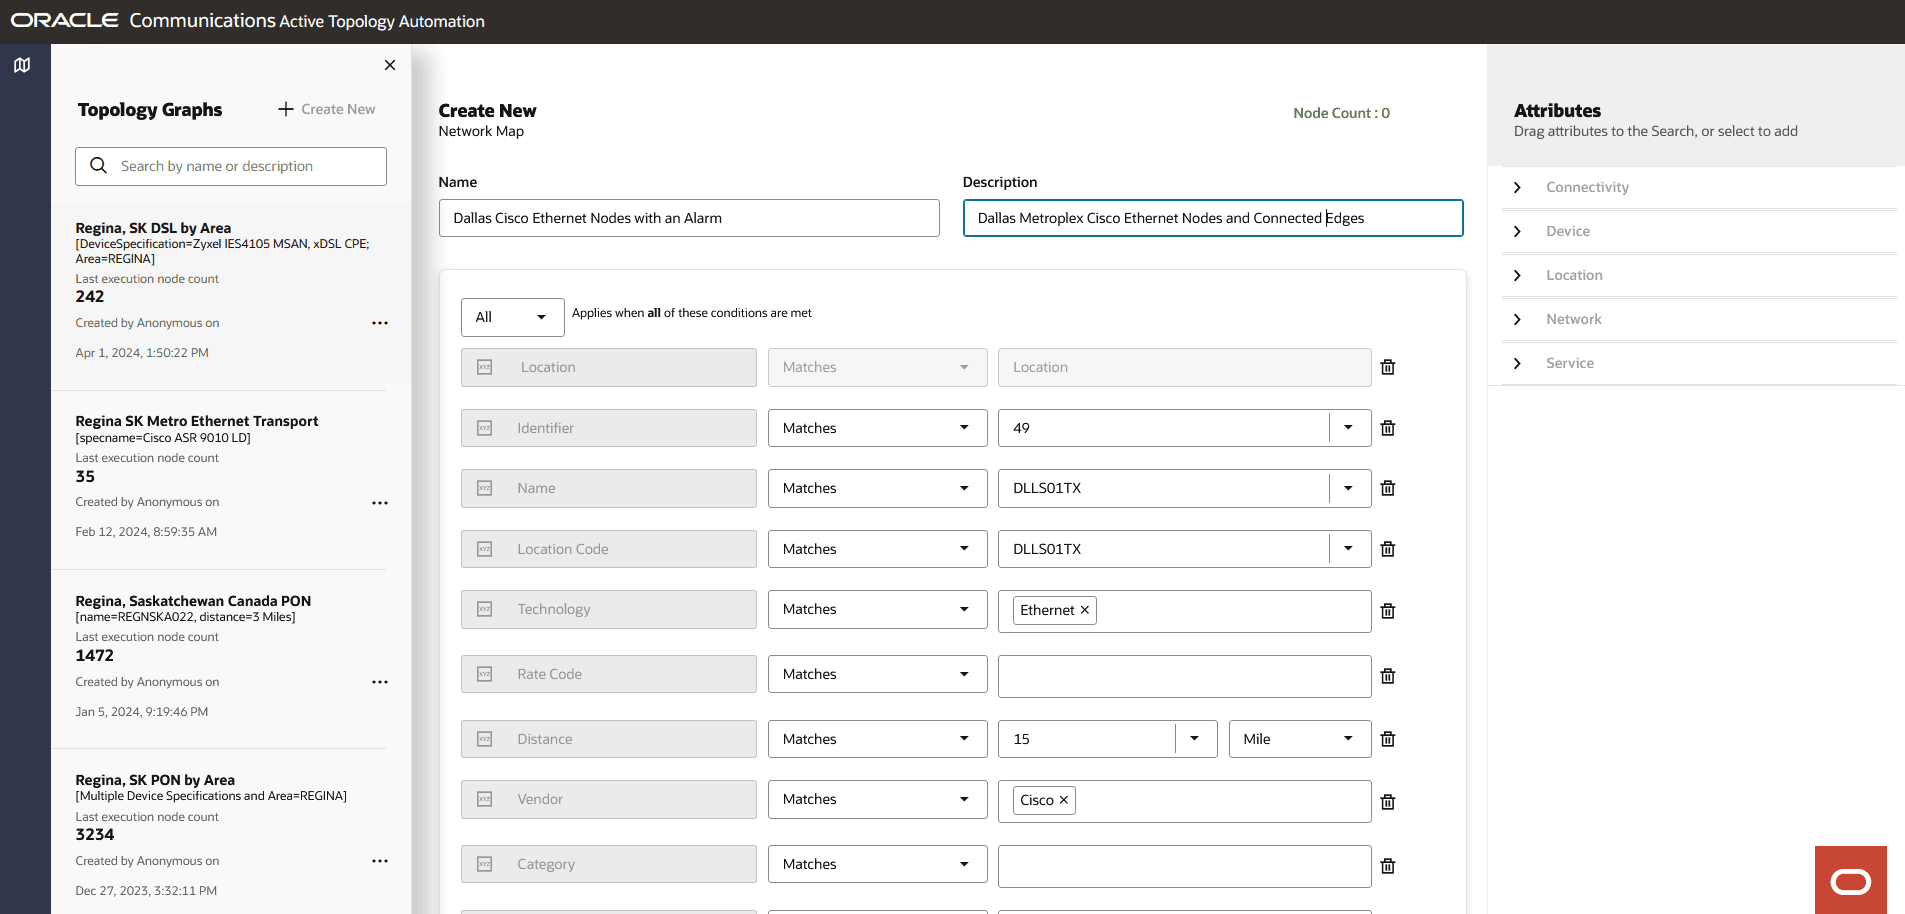
The following image shows the Create New search pane.
Figure 4-1 Customizing Network Search
Selecting Attributes while Customizing a Topology Graph Search
You can select an entity and its corresponding attributes to customize a topology graph search. Select or enter the corresponding values of these attributes to customize your search. The search returns results with a topology graph that contains only the selected entity types.
You can add only one entity from the list of entities. Adding an entity adds all the corresponding attributes to the search.
The list of supported entities are:
- Connectivity
- Device
- Location
- Network
- Service
Each entity has a list of attributes. You can select all or a few of these attributes. By selecting a set of attributes, you can customize your topology graph to display only the corresponding information.
Note:
The customized topology graph search returns results of both devices and connectivities even when the entities selected are of a specific type (such as device, location or connectivity). For example, if you have selected a device entity and specified the device name, the results will still return all the connectivities linked to the device. You can also provide additional criteria such as Technology and RateCode to get the desired connectivities from the specified device.
Except for Service, all other entities have both generic and entity-specific attributes. The list of these specific attributes varies with the entity that you select. The Service entity has only two attributes, Name and Version.
Table 4-1 lists the generic attributes.
Table 4-1 Generic Attributes
| Attribute | Description |
|---|---|
| Identifier | The identifier of the topology component. You can enter an identifier or select from the list of identifiers. |
| Name | The name of the topology component. You can enter a name or select from the list of names. |
| Technology | Enter the technology to search for the topology components operating under the technology. This is a connectivity filter. |
| Rate Code | Enter the rate code to view the topology components that are associated with it. This is a connectivity filter. |
| Hops | Enter the number of hops or select from the list, to search for the topology components within that number. |
| Vendor | Enter the name of the vendor to search for all the topology components of the vendor. This is a device filter. |
| Category | Enter a category for Network or a device category
for Connectivity, Device, and Location. For
Network category, this is a network filter. For other
categories, it is a device filter.
The values are defined by the customer. See "Dynamic Attribute Mapping between UIM and ATA" in Unified Inventor and Topology Deployment Guide for more information. |
Table 4-2 lists the entity-specific attributes.
Table 4-2 Entity-Specific Attributes
| Attribute | Description |
|---|---|
| Domain |
Enter the domain or select from the dropdown. This attribute is a Device filter. |
| Specification |
Enter the specification that is used to create the entity. This attribute is specific to Connectivity and Device. |
| Node Type | Enter the node type. This is a Device filter. |
| Distance |
Enter the distance to search for all the topology components available within the given distance from the location or device. Select the distance unit from the list beside this field. You can select Meter, Kilometer, or Mile as distance unit. This attribute is specific to Location and Device. |
| Device Specification |
Enter the device specification that is used to create the entity. This attribute is specific to Location and Network. |
| Area |
Enter the location area to search for all topology components available within that area. This attribute is specific to Location. |
| Circle |
Enter the circle to search for all topology components within the circle. This attribute is specific to Location. |
| SubCategory |
Enter the subcategory to search for all subnetworks with the specified types. See "Viewing Networks and Subnetworks" for more information. This attribute is specific to Network. |
| Topology Type |
Enter the topology type. This attribute is specific to Network. |
| Sub Type |
Enter the topology sub type. This attribute is specific to Network. |
Note:
Category, Domain, Node Type, Area, Circle, SubCategory, Topology Type, Sub Type are defined by the customer through Topology Mappings.
Viewing Networks and Subnetworks
You can view multiple layers of a network by navigating up or down the network hierarchy.
An example of a network hierarchy is:
National > Regional > CircleCore > Aggregate > Pre-Aggregate > Access
You can have either of the following types of networks:
- Multiple layers within a single network that follows the network hierarchy. For example: A Regional network has few nodes and one Aggregate subnetwork. You can see the subnetworks within the Aggregate subnetwork by clicking on it.
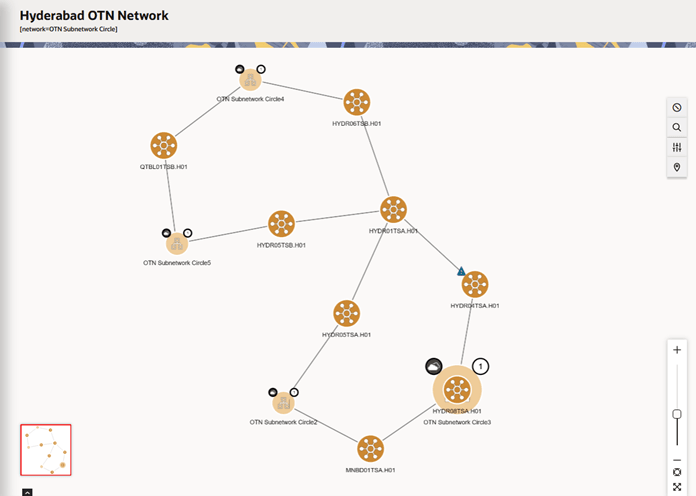
- Different types of subnetworks within a single parent network. For example: You can have a Regional network that in turn has its own nodes along with Aggregate and the corresponding Access networks. The nodes within the Access network can connect to the nodes within the Regional network through the Aggregate network. Figure 4-5 shows a network having different types of subnetworks.
- All the devices and connectivities exist within a single network. Oracle does not
recommend this approach.
Note:
Setting a device category attribute is supported on device or connectivity search.
You can open any network, whether a subnetwork or parent network, using the network name. The topological view for the selected network will automatically show both parent networks and their connections as well as subnetworks and their connections.
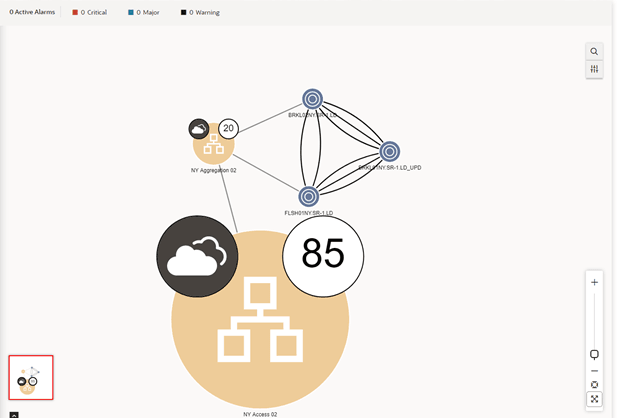
The subnetwork appears with a network badge. The number of internetworking nodes within the subnetwork appear as a number on the icon. The internetwork nodes of a subnetwork are the nodes that have a connection (edge) with the nodes in the parent network. In most situations, the internetwork nodes show the ingress and egress paths into the network and simplify the expansion and viewing of the network.
However, in some situations, you may wish to drill down into the subnetwork and view all of the nodes and edges:
- Right-click on the subnetwork and select Isolate to view all the nodes and edges associated with the subnetwork. This option isolates the subnetwork alone into a new view and does not show all the nodes and edges of the parent network, but shows the node connecting it to the parent network. See "Isolating a Subnetwork in a Topology Graph" for more information.
- Use the Expand Node action to show the internetwork nodes.
- Use the Expand Subnetwork option to view all nodes and edges along with the access nodes in the canvas. See "Expanding Subnetworks in a Topology Graph" for more information.
Note:
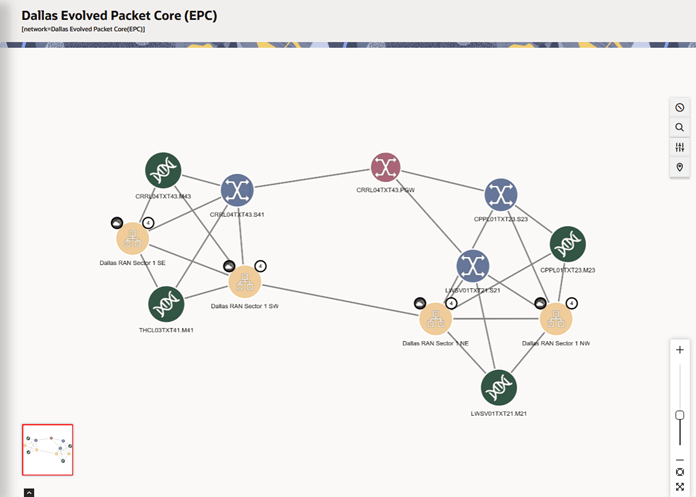
After you expand or isolate a subnetwork, you can view the subnetwork name on the top-left corner of the canvas.Figure 4-2 shows the Dallas EPC network with four subnetworks, where each subnetwork has four internetwork nodes.
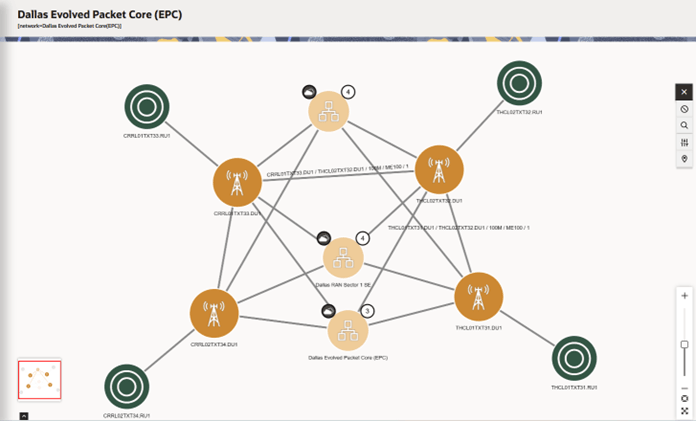
Figure 4-3 shows the Isolate view of the Dallas RAN Sector 1 SE subnetwork. It shows all the nodes in the subnetwork and all interconnections to that subnetwork.
Figure 4-4 Expand Node view of a Subnetwork
Figure 4-4 shows the Expand Node feature with one internetwork node.
Figure 4-5 Subnetworks within a Single Network
Expanding Subnetworks in a Topology Graph
You can expand subnetworks within a topology graph to visualize the internal nodes (including the access nodes), connectivity, and hierarchical relationships directly in the canvas.
Expanding subnetworks is supported to multiple levels.
When you expand a subnetwork, all internal nodes appear (along with access nodes) in the canvas. When you collapse the expanded subnetwork, all internal nodes (both access and non-access nodes) continue to appear in the parent network. Therefore, using Expand Subnetwork option is disabled after the first use as the subnetwork stays expanded with all internal nodes appearing.
After you expand a subnetwork, you will observe the following limitations:
-
The Group By option under Display Settings is not available.
-
When you choose Geo Map Layout from Display Settings, you receive a message that the expanded subnetworks will not be in the same state when toggled back from the geo map layout. Click OK to proceed.
To expand subnetworks in the topology graph:
- Open the topology graph.
- Locate the subnetwork that you want to expand.
Note:
Subnetwork nodes are represented by a unique icon. - Right-click on the subnetwork and select Expand Subnetwork from
the context menu.
The subnetwork is expanded within the current canvas. The canvas automatically lays out the nodes and edges in the subnetwork for optimal visibility. The subnetwork name appears on the top-left corner of the canvas.
Note:
Use Expand Node to view only access nodes within a subnetwork and use Expand Subnetwork to view all internal nodes (along with access nodes) within a subnetwork. - (Optional) You can click
 icon to search for components within the topology graph.
The Search and Filter Topology panel appears on the left navigation pane that shows all internodes of the subnetwork along with all nodes and edges of the parent network in a tree view.
- (Optional) Expand multiple subnetworks including the nested subnetworks.
- Use Zoom options or move the subnetwork for a better visibility.
- Right-click on the subnetwork and select Collapse Node from the
context menu.
The expanded subnetwork is now collapsed into the parent network. However, all internal nodes of the subnetwork continue to appear in the parent network.
Isolating a Subnetwork in a Topology Graph
You can isolate a subnetwork within a topology graph to view all the nodes and edges associated with the subnetwork. This option isolates the subnetwork alone into a new view and does not show all the nodes and edges of the parent network, but shows the node connecting it to the parent network.
Isolating subnetworks is supported to multiple levels.
To isolate a subnetwork in the topology graph:
- Open the topology graph.
- Locate the subnetwork that you want to isolate.
Note:
Subnetwork nodes are represented by a unique icon. - Right-click on the subnetwork and select Isolate from the
context menu.
The subnetwork is isolated from the parent network and canvas shows only the isolated subnetwork with all its subnetwork nodes. The subnetwork name appears on the top-left corner of the canvas.
- (Optional) You can click
 icon to search for components within the topology graph.
The Search and Filter Topology panel appears on the left navigation pane that shows only the nodes and edges within the isolated subnetwork in a tree view.
- (Optional) You can further isolate the nested subnetworks.
- Use Zoom options or move the subnetwork for a better visibility.
- Use
 to exit the isolate mode.
Viewing the Working and Protected Paths
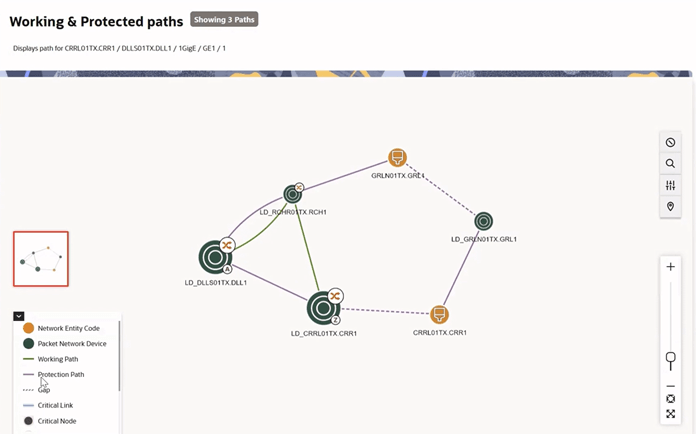
You can view the available paths for any connectivity on the canvas by right clicking on the edge and selecting Show Paths. The Show Paths action opens the Working and Protected Paths page. As shown in Figure 4-6, the page displays that three paths are available for the selected connectivity 1GigE connectivity from CRRL01TX to DLLS01TX.
The legend in Figure 4-6 displays the following:
-
The green path represents working paths. There is one working path in the above figure.
-
The purple path represents protection paths. There are two protection paths in the figure.
-
The A and Z icons represent the termination points for the connectivity trail.
-
The
 icon represents a cross-connection on the device.
-
The
 icon represents a jumper on the device.
If you click on either the cross-connect or jumper icons, the device interface or port details are displayed, as shown in Figure 4-7.
Figure 4-7 View of Device Interface Details
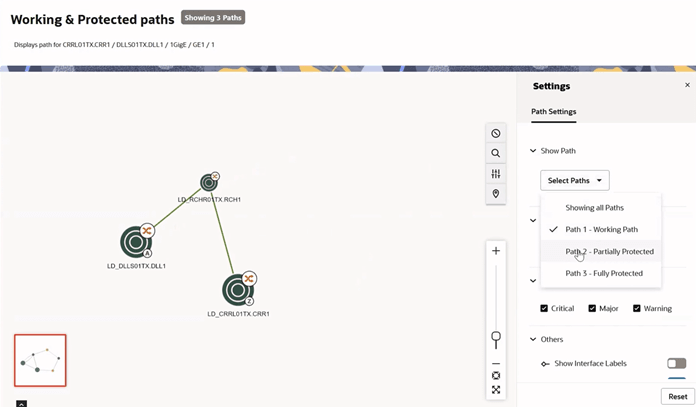
You can filter specific paths in the Settings panel. For example, Figure 4-8 illustrates a scenario where only Working Paths are selected to be shown. It is also possible to view all paths, or any desired combination of paths. In this example, Path 2 provides Partial Protection and Path 3 provides full protection.
Figure 4-8 Customizing Paths to be Displayed on Working and Protected paths page
You can also choose the Show Interface Labels, Show Connectivity Labels and Show Node Labels options in the settings panel as in Figure 4-9. By default, Show Connectivity Labels and Show Node Labels are enabled and Show Interface Labels is disabled. Enabling the Show Interface Labels option will display the device interface ID/Name, or the Port ID/Name.
Figure 4-9 Interface Labels Enabled on Working and Protected Paths
Viewing Connectivities in a Layered View
You can use the layered view to display the hierarchical structure of services and connectivities within the topology graph. You can use the following options:
- To view connectivities below a selected connectivity, use Show Underlay.
- To view services or connectivities above a selected connectivity, use Show Overlay.
To view connectivities in a layered view:
- Select the required connectivity from the topology graph.
- Right-click, and then select one of the following options from the context menu:
- Show Paths: To view the paths associated with the selected connectivity in the topology graph. For more information, see "Viewing the Working and Protected Paths".
- Show Underlay: To view the connectivities below the selected connectivity in the hierarchy. For more information, see "Viewing Underlay Connectivities in a Layered View".
- Show Overlay: To view the services or connectivities above the selected connectivity in the hierarchy. For more information, see "Viewing Overlays in a Layered View".
Viewing Underlay Connectivities in a Layered View
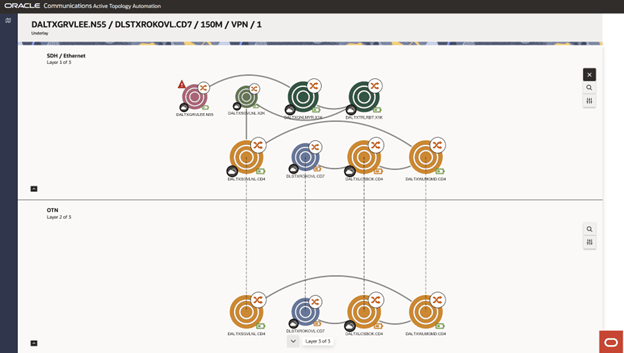
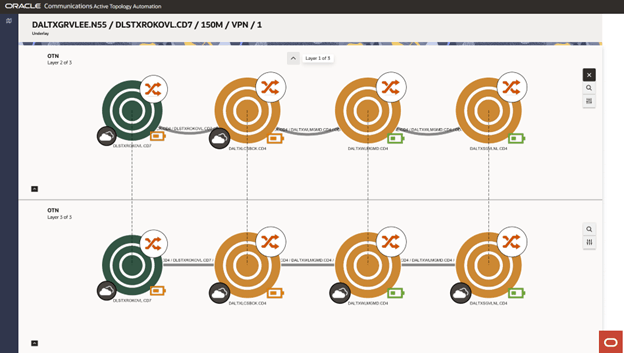
The layered view displays the name of the selected service or connectivity in the page title, with Underlay shown as the subtitle. The canvas shows the first two enabling layers. In the top-left corner of each layer, you can find the technology, layer number, and total number of layers. Nodes that exist in both visible layers are linked by a dashed line, called the bridge connection, making it easy to identify the shared nodes. Moving a common node in one layer automatically moves the corresponding node in the other layer. The following image shows the Underlay page with common nodes.
Note:
You can have unlimited number of enabling layers in a layered view.To view underlay connectivities in a layered view:
- Right-click on the required service or connectivity and select Show
Underlay.
The Underlay page appears, displaying a layered view of all nodes and connectivities under the selected connectivity or service.
- Select a network element or a connectivity in a layer to view its details.
- Click the Settings icon to adjust the settings.
- Use the Layer n tab or Global tab to customize layer-specific
or global settings.
Where, ‘n’ indicates the selected layer number.
- On the Layer n tab:
- Select a layout from the Layout list.
Note:
If you choose Geo Map Layout, the view switches to the map layout. - Enable the required options in Alarm Status.
Note:
You can choose multiple alarm statuses.
- Select a layout from the Layout list.
- On the Global tab:
- Select the desired path from the Show Path list.
Note:
You can select either a single path or all available paths. By default, the first path is displayed on the canvas. - Set the maximum number of paths using the Max Paths
list.
Note:
The maximum number of paths supported is 10. - Enable required labels and synchronization settings under
Other Settings. The options are:
- Show Interface Labels: By default this label is turned off.
- Show Connectivity Labels: By default this label is turned on.
- Show Node Labels: By default this label is turned on.
- Bridge Node Synchronization: By default this label is turned on. If you do not want the corresponding node in the adjacent layer to move when you move the selected node, turn off this label.
- Select the desired path from the Show Path list.
- In the layered view, click the Cross Connect icon above the network element to view the cross connects.
- View the node capacity by clicking the battery icon below the network
element. The bottom-right corner shows the capacity badge that indicates the current
node capacity in 0–25%, 25–50%, 50–75%, or 75–100%
range.
If there is an alarm on the node, an alarm badge appears. If the node is part of a network, the network badge appears in the bottom-right corner. Hover over the network badge or the node, the corresponding network name appears above the node.
- Zoom in or out on the desired layer using your mouse to adjust the view.
- Refer to the legend at the bottom of the layered view for icon, path, and specification definitions, and their corresponding colors and symbols.
- If there are more than two layers, a dropdown arrow appears indicating
the number of additional layers available. Select the down arrow to navigate to the
next layer. The canvas will scroll showing layers 2 and 3.
Similarly, if more layers exist above the currently visible ones, an upward arrow appears indicating the additional layers above.
The following image shows the view when there are more than two layers.
Viewing Overlays in a Layered View
A connectivity can have multiple services or connectivities running on it. To visualize a specific overlay, you must select the required connectivity, facility, channel, or service.
To view overlay connectivities:
- Right-click on the desired connectivity and select Show
Overlay.
The Overlay page appears and lists all connectivities and their IDs above the selected connectivity.
Note:
If there is only one overlay, this page does not appear. - Click an ID link from the list to view details for that connectivity.
The corresponding connectivity and service details are displayed in a table in separate tabs.
Note:
If the circuit is channelized you can select either the facility or a specific channel. - Select the required connectivity or service on the Service tab to view the corresponding underlays. The following image shows the layered view that appears.
Viewing Underlays for Service Topology
If you access the Service Topology directly using the Topology link from UIM
or search for a specific Service Topology with the ATA Search feature, you can view the
underlays by selecting the layered view icon ![]() located along the right margin of the canvas.
located along the right margin of the canvas.
Note:
The underlay view shows only the first path for all the connectivities present. To view all available paths, you can check the individual connectivity underlays.Searching within a Topology Graph
You can search for the required network elements within a selected topology graph. You use the Search icon at the right corner of your topology canvas.
Click on the Search icon opens a search panel on the left. You can select the following options while searching:
- Select Search and Filter Topology to search, filter, and view the topology based on a search criterion. See "Using Search and Filter Topology" for more information.
- Select Ring Search to search the naturally occurring rings in the topology graph displayed on the canvas. See "Using Ring Search" for more information.
Using Search and Filter Topology
The Search and Filter Topology panel has a search bar with filter options under it. Each filter option represents one filter type, such as Location, Network Type, and so on. Each option has a value chosen by default. Below the search bar is a list of all the nodes and edges in a topology graph. The nodes are grouped into categories by Location, while the edges are grouped separately.
The following filters and child filters are available in ATA:
-
Location
-
Location Code
-
Alarm (Yes, No)
-
Device Type
-
-
Network Type
-
Alarm (Yes, No)
-
Device Type
-
-
Device Type
-
Alarm (Yes, No)
-
-
Technology
-
Rate Code
-
Connectivity Specification
-
When a user selects any filter, the corresponding child filter (the second-level filter) appears, and it's corresponding values can be selected.
Use Search and Filter Topology as follows:
- Search for a network element or multiple network elements within the
topology graph.
Note:
You can use a global search by entering a required value to search for the network element.
The search is case sensitive.
- View all nodes and edges in a tree view.
- Select the required nodes or edges from the tree view to the selected elements highlighted within the topology graph and an overview panel appears on the right-side that shows the details of the selected node or edge.
- Use the filter chip options to filter and search for the required network elements. You get the filter chip options based on the network elements you select.
- Use the filter chip options as follows:
- Select an option to view the corresponding list of network
elements.
Note:
You may select any number of filter chip options. - Click on the selected option within the Search bar to view a list of values you can select.
- Select the required value to view the list of network elements
for the selected value.
Note:
The highlighted nodes appear along with their associated edges in the canvas. When filters are removed, the entire topology appears.
- Select Node or Edge to toggle between the list of
nodes or edges.
Note:
For edge search, the terminal nodes of the matching edges appear on the canvas.
- Click on a filter chip to change the value of the corresponding filter chip.
- Select a filter chip to view only the corresponding part of the topology graph in the canvas.
- Close the filter option to deselect the filter.
- Select an option to view the corresponding list of network
elements.
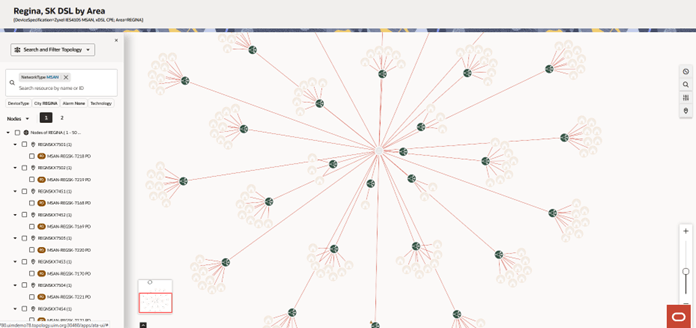
Figure 4-10 Example of Network Type Filter Applied to a Network
Figure 4-10 shows an example where the Network Type filter with value "MSAN" has been applied. The nodes are filtered in the tree-view on the left panel as per the value, and highlighted in the canvas.
Using Ring Search
A network ring is a closed loop of nodes and edges that starts from a node, connects other nodes and ends at the starting node.
Ring Search allows the user to find all the naturally occurring rings in a searched network displayed on the canvas. Using the Ring Search, you can search for all rings based on nodes and edges. The Ring Search can be customized by creating a custom graph based on the criteria you wish to use in identifying the rings. For example, you can build a search querying all devices with a specific technology and connectivity with a specific rate code for a specific area.
When you switch to the Ring Search, the list of rings in the graph appears on the left side of the screen.
Note:
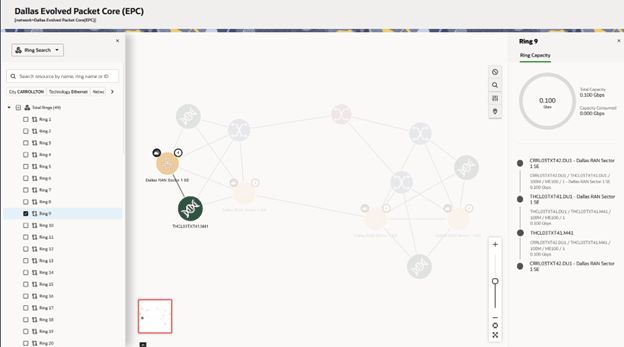
For very large graphs the calculation of rings is limited, but you can choose to calculate all rings for a moderate graph.You can view ring information by selecting a ring from the list. The chosen ring is highlighted on the canvas, and the Ring Capacity panel appears on the right side of the canvas.
The Ring Capacity panel provides the following details:
- Total Capacity: The total capacity of all edges within the ring.
- Capacity Consumed: The sum of the capacity values of all edges within the ring.
- A linear visualization of the ring with all nodes and the corresponding edges within the ring.
You can choose to view any number of rings or all rings available on the topology. When you select a ring, the associated nodes and edges appear in a tree view in the Ring Search panel. If the list of nodes/edges/rings is too long, then it is divided into different pages that can be viewed by clicking the page numbers listed next to the dropdown menu.
You can also filter rings using the filter chip options below the search bar. For example, if you select a filter chip for a specific location, all rings that are available within the filtered location in the rendered network appear. See "Viewing and Filtering Rings within a Searched Network" for more information.
The following image shows the ring search within a searched network:
Figure 4-11 Search for a Ring within a Network
Viewing and Filtering Rings within a Searched Network
To view rings within a searched network:
- From the topology graph, click on the Search icon.
The search panel appears.
- Select Ring Search from the dropdown list.
The list of all rings available within the network appears.
- Select the required ring from the list.
The selected ring gets highlighted within the network along with Ring Capacity panel on the right side. You can see the list of nodes and edges associated with the selected ring in a tree view.
Note:
You can select multiple rings from the list of rings.
To filter rings:
- Use the filter chip options available under search to view the rings available for
that filtered criteria within the searched network.
Note:
You can use multiple filter chips to view the rings that meet the filtered criteria. - Click on the selected filter chip to change the value of the filter.
- Search for any ring by its name or ID using the global search option.
- Search for any node or edge within the ring using the global search option.
