9 Getting Started with Service Impact Analysis
Service Impact Analysis enables network operators to visualize and analyze the services, resources, locations, networks, and other impacts affected by events occurring on physical, logical, or virtual infrastructure. These events, such as faults at the node or sub-node level (for example: shelf, card, port, or device interface), are received from the Assurance systems that monitor and collect the real-time network events.
Service Impact Analysis correlates these events to assess the impacts and displays the analysis in the form of interactive charts and reports. It allows operators to view, sort, and analyze the effects of these events, enabling faster identification of root causes and affected areas. Operators can also generate customized reports and apply advanced filters that help in refining their analysis and enabling faster and better resolutions.
Note:
Service Impact Analysis supports an Assurance system using TMF 688 Event Management API and TMF 642 Alarm Management API.
The supported resource types are:
- Physical Port
- Device Interface
- Equipment
- Physical Device
- Logical Device
The supported resource sub types are:
- Shelf
- Card
Accessing Service Impact Analysis
- Use the Service Impact Analysis application's URL
that is generated after configuring the Service Impact
Analysis microservice. See "About
Unified Inventory and Topology" in
Unified Inventory and Topology Deployment
Guide for more information.
Note:
You require SSO credentials to access Service Impact Analysis. If you have already logged into UIM or ATA using SSO, you do not have to log in again to access Service Impact Analysis. - On the landing page, click Service Impact
Analysis.
The Overview page appears.
About the Service Impact Analysis User Interface
Data in Service Impact Analysis can be viewed and analyzed using tabs that provide various features.
The tabs provide the following functionality:
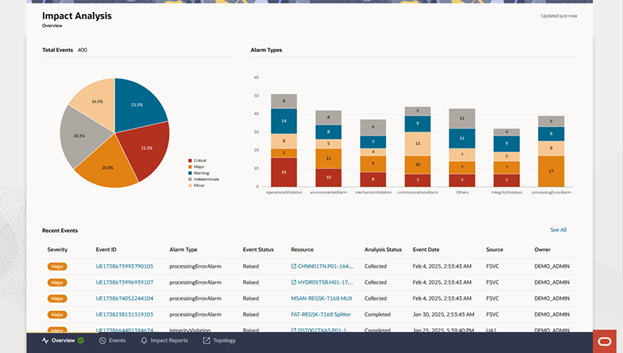
- Overview: Use this tab to view the service impacts summary, alarm events, alarm severity distribution, and the 10 most recent events.
- Events: Use this tab to view, filter, sort, and generate reports of the list of all alarm events that occurred.
- Impact Reports: Use this tab to customize reports using filters and to export the reports to XLS format.
- Topology: This tab opens ATA. For more information on ATA, see "About ATA".
The following figure shows the home page of Service Impact Analysis.
Figure 9-1 Service Impact Analysis Home Page
About Alarm Types
The impacts data is grouped into the following alarm types based on their severity:
- Operation Violation
- Environmental Alarm
- Mechanism Violation
- Communications Alarm
- Integrity Violation
- Processing Error Alarm
- Quality of Service Alarm
- Equipment Alarm
- Physical Violation
- Security Service
- Time Domain Violation
About Event Statuses
The events have the following statuses that originate from the assurance system:
Table 9-1 Event Status
| Event Status | Description |
|---|---|
| RAISED | The alarm is detected. |
| UPDATED | The alarm status is successfully updated. |
| CLEARED | The alarm is resolved and is no longer active. |
| REJECTED | The alarm status change is rejected due to an error or other reasons. |
About Analysis Status
Service Impact Analysis has the following lifecycle statuses:
Table 9-2 Analysis Status
| Analysis Status | Description |
|---|---|
| PENDING | The event is received but not assigned to anyone to analyze. |
| ASSIGNED | A user (or Owner) is assigned to analyze the impact. |
| INITIATED | The system has started analyzing the impacts in UIM. |
| COLLECTED | The system has completed the analysis of impacts in UIM. Analysis status value is changed to COLLECTED if the analysis is completed successfully. |
| FAILED | The system has failed in analyzing the impacts in UIM. If the initiate analysis is not completed successfully, the analysis status is changed to FAILED. |
| ANALYZING | The user (or Owner) has started analyzing the impact. |
| COMPLETED | The analysis of the impact is completed by the user (or Owner) and the system. |
Note:
The Analysis Status can be COMPLETED only if all the impacted items are QUALIFIED or DISQUALIFIED.
