3 Getting Started with ATA
ATA helps you with a pictorial representation of the topology information that you collect from UIM. You can customize the layouts and other display settings according to your choice. You can customize your search, view and analyze each topology component, its associated resources, and its capacity consumed.
Accessing ATA
- Use the ATA application's URL that is generated after configuring
the ATA microservice in a Kubernetes environment. See "About Unified Inventory and
Topology" in Unified Inventory and Topology Deployment
Guide for more information.
Note:
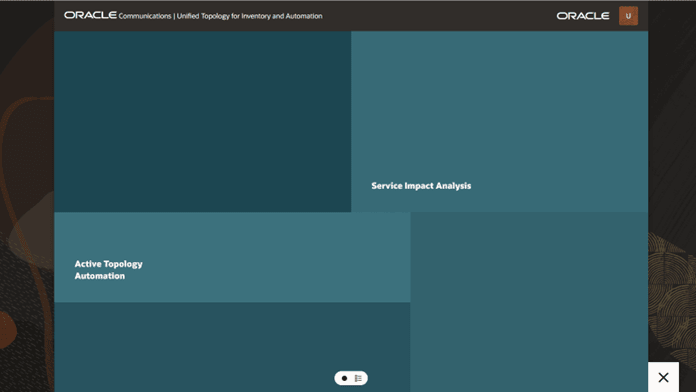
You require SSO credentials to access ATA. If you have already logged into UIM using SSO credentials, you do not have to log in again to access ATA and vice versa. - On the UIM home page, in the left navigation pane, click Topology. This opens the ATA application's home page in a new tab or browser window, as shown in . See "Getting Started with Unified Inventory Management" in UIM Online Help for more information.
- Within UIM, open the summary page of a network, and then navigate to the Associated Resources tab. Click View Topology for a resource. This opens the ATA application and displays the topology graph for the corresponding resource. See "Getting Started with Unified Inventory Management" in UIM Online Help for more information.
- Within UIM, click Topology on the corresponding summary page
of any of the following entities:
- Pipe
- Connectivity
- Equipment
- Physical Device
- Logical Device
- Service
- Property Location
- Place
About the ATA Home Page
On the top-right corner of the ATA home page, you can find a user profile drop-down list with some options. You can use these options for:
- Opening the ATA user's guide using Help.
- Logging out of ATA using Sign Out. This action logs you out of the application and displays the ATA login page. You can log out of the application from ATA and Service Impact Analysis Landing page.
You can also access UIM from the General Information tab of a topology component's summary page. See "Accessing UIM from ATA" for more information.
You can also localize ATA UI in a different language. To localize ATA UI, see "ATA Localization" in Unified Inventory and Topology Deployment Guide.
About the Topology Graph
On the home page, you can search for a topology graph and view it.
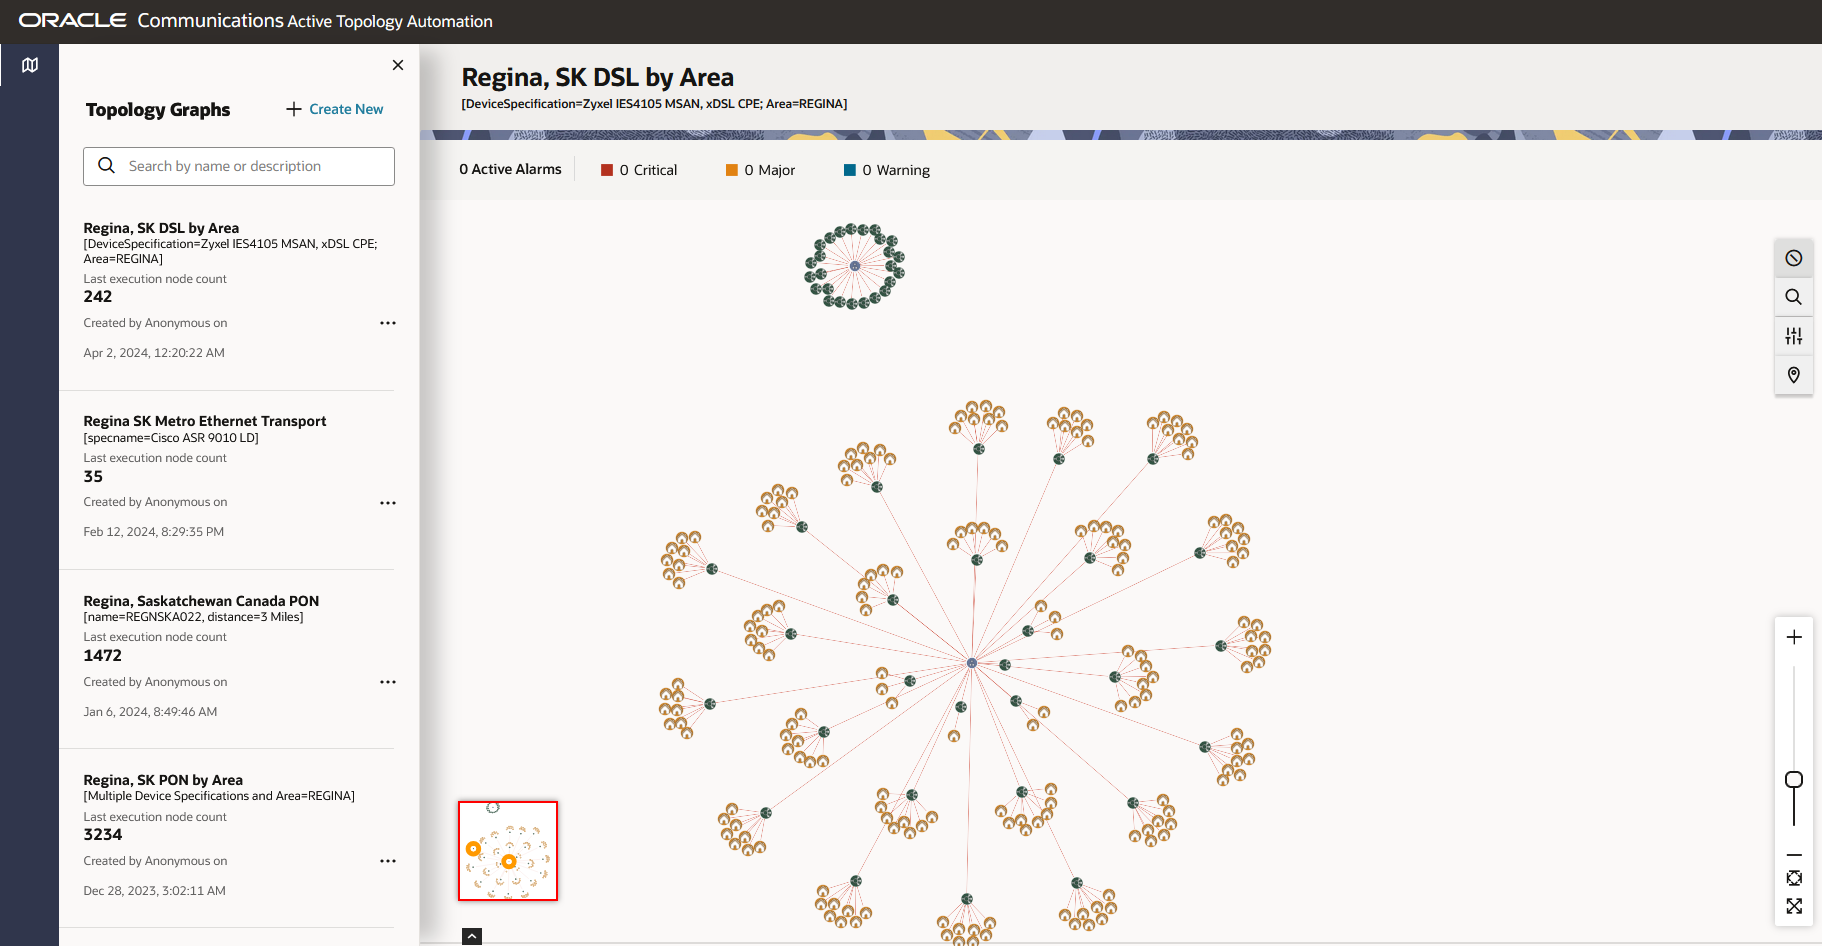
The following figure shows the ATA home page with the topology graph of a network.
Figure 3-2 Topology Graph View of a Network
- A left navigation bar that shows the list of topology graphs you have created. You can search for a topology graph using the Search field or you can create a new topology graph using Create New option.
- The diagram canvas on which all the topology components are depicted.
- The Alarm Details pane that shows the number of active
alarms. Click the
 icon above the Search option at the right side of the screen
toggles its visibility.
Note:
The alarm details show the number of devices displayed on the topology graph with alarms. The devices with alarms appear with an alarm icon. If a device has 10 alarms, the system counts it as 1 device with alarms. - A minimap shows the overall view of the topology graph. If you
select a network element, the minimap shows the selected network element
highlighted and the location of the element within the topology graph.
Note:
The minimap shows the corresponding part of the graph when you zoom in or zoom out. - Selecting a node shows the corresponding overview details within the Overview panel.
- A legend in the left-bottom corner (below the minimap) that opens when clicked. It describes the custom colors and icons that represent the corresponding specifications in the topology graph along with the corresponding device count. The default and custom icon preferences are grouped as separate lists, as are specifications. Clicking on any of the specifications or icons or edges highlights all the respective nodes and edges on the graph.
- A zoom scroll bar on the right-end corner that helps you to change the zoom settings. You can change the zoom settings by scrolling the mouse or by using these controls.
- A Settings icon that opens the Settings pane to change the display and advanced settings to customize the graph as per your choice. See "Changing the Topology Graph Settings" for more information.
- A Search text box to search for a specific topology component within the topology graph. See "Searching within a Topology Graph" for more information.
On the topology graph, you can select a topology component, and view its details. A topology component can be a node or an edge. If the selected component is a node, you can isolate, expand, or collapse the node by right-clicking on the node and selecting the corresponding option. See "Viewing the Details of Topology Components" for more information.

