5 Changing the Topology Graph Settings
This chapter describes how to change topology graph settings.
Opening the Settings Pane
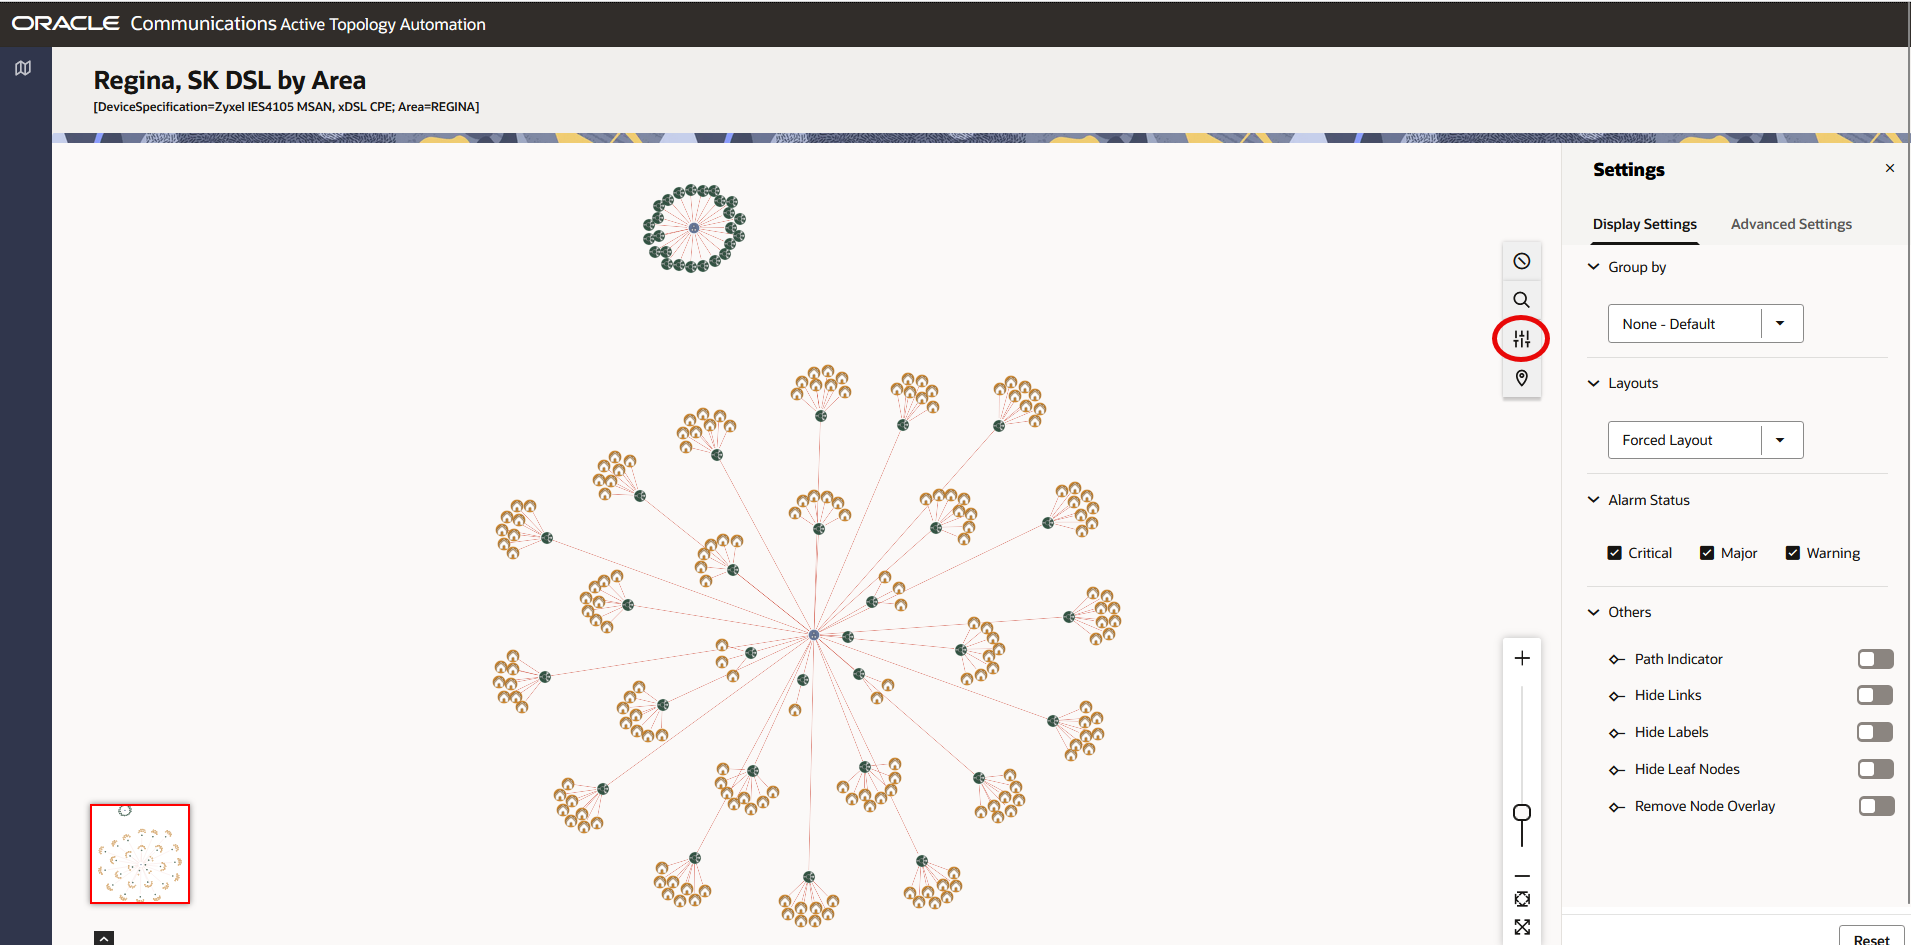
Use the Settings icon from the quick navigation bar to open the Settings pane.
The Settings pane helps you to change the display and advanced settings.
Changing the Display Settings
You can change the display settings of the topology graph using the options under the Display Settings tab.
The following table provides the list of options you can use to change the display settings.
Table 5-1 Display Settings
| Setting Name | Description |
|---|---|
| Group by |
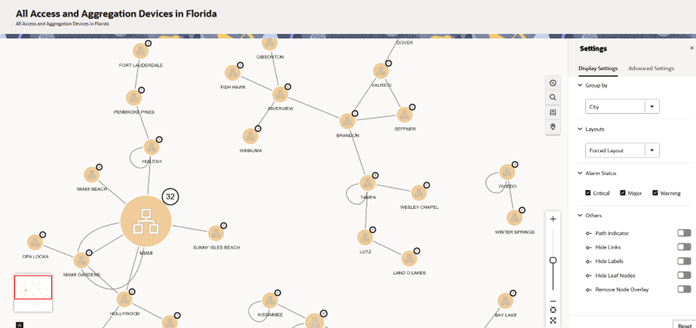
Select an option to group the topology components. You can group the components by state, city, postal code, district, province, location code, and circle. The Group by dropdown list shows only the options that have corresponding data populated in the graph. For example, if province is not populated in a graph, the province option does not appear in the dropdown list. Figure 5-2 depicts an example where the topology components are grouped by City. This mechanism builds containers showing the cities with the highest concentration of devices. |
| Layouts | Select an option to change the layout of the topology graph. Forced Layout is the default layout. See "Changing the Topology Graph Layout" for more information. |
| Alarm Status | Select the required alarm status types to view the corresponding details in the topology graph. You can select one or more alarm status types. The available alarm status types are Critical, Major, and Warning. |
| Others | Enable an option to change the corresponding setting. You can hide the links, labels, and leaf nodes and remove the node overlaps by enabling the corresponding option. |
| Reset | Click Reset to change the display settings back to the default options. |
Table 5-2 Options under Others Section
| Option | Description |
|---|---|
| Path Indicator |
The edges displayed on the topology graph represent trail paths between two nodes. When you turn on Path Indicator (under display settings) you will see the number of paths available, and you can drill down to see the working and protect paths by selecting the Show Paths action on the edge. |
| Hide Links |
You can hide links between the nodes by turning on this option. |
| Hide Labels |
You can hide labels between the nodes by turning on this option. The labels do no appear even if you hover over the node. |
| Hide Leaf Nodes |
You can hide all leaf nodes in the topology graph by turning on this option. This option displays the number of leaf nodes that each of the parent nodes have. |
| Remove Node Overlay |
You can remove node overlay in the topology graph by turning on this option. This option is not available for Geo Map Layout. |
Figure 5-2 Example of Group By Applied on a Network
Changing the Topology Graph Layout
You can change the layout of a topology graph into any of the layouts listed in the following table:
Table 5-3 Topology Graph Layouts
| Layout | Description |
|---|---|
| Forced Layout | Displays the topology components in an aesthetically pleasing way. This is the default layout. |
| Geo Map Layout | Displays the topology graph in a geographical map view.
See "Working with the Geo Map Layout" for more information.
Note: Geo Map Layout can be toggled by selecting the location pin on the topology graph. |
| Circular Layout | Displays the topology components in a circle. |
| Grid Layout | Displays the topology components in the form of a grid. |
| Hierarchical Layout | Displays the topology components according to the hierarchy and without any overlaps. |
Note:
If you isolate a node or open its summary, the layout resets to the default option.
Working with the Geo Map Layout
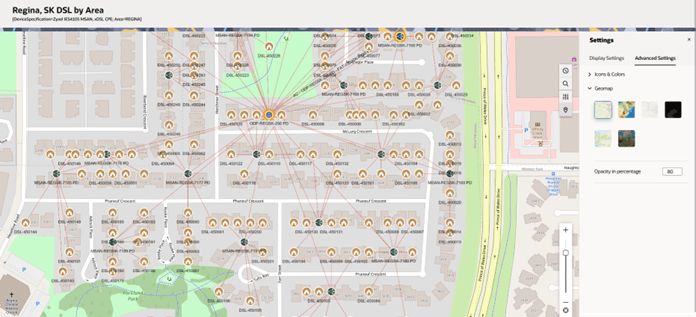
You can view the topology graph in a geographic map layout. In a Geo Map layout, all the topology components appear according to their geographic locations.
You can view Geo Map layout using the following ways:
- Select Geo Map Layout from the Layouts field of the display settings.
- Navigate to the Advanced Settings tab and select a map background under the
Geo Map section.
Note:
Selecting a geo map background changes the map layout (under Display Settings > Layouts) to Geo Map Layout.
You use the Geo Map layout as follows:
- Open the topology graph in the Geo Map layout.
- Under the Advanced Settings tab, select a map background under Geomap.
- Use the following zoom options:
- Zoom in to a specific network element to view the exact location of it within the geo map.
- Zoom out of the map to view all network elements or all graphs within the specific geographic location.
- Click the Fit to Zoom icon in the zoom settings bar to fit to the standard view of the geographic location.
- Click the Full Screen icon in the zoom settings bar to view the map in full screen.
- Enter a value between 0 and 100 in Opacity in
Percentage to set the opacity percentage of the map.
Note:
You use this option to minimize the map background. - Use
 to toggle between the Geo Map layout and the canvas layout.
You can view the details of a topology component by clicking on it. This action opens an Overview tab that includes the alarm details associated with the component. See "Viewing the Details of Topology Components" for more information.
You can change the geographical map type on the Advanced Settings tab. See "Adding Advanced Settings" for more information.
Adding Advanced Settings
You can further customize the topology graph by adding the following advanced settings:
- Using the Icons & Colors option, you can enable or disable icons for topology components.
- You can change the type of geographical map using the Geo Maps option.
- You can change the opacity percentage for the selected geographical map.
Customizing Node Icons in the Topology
You can customize node icons in the topology graph by choosing from a predetermined or uploaded range of icons. You can add multiple customizations by filtering nodes according to specification and network type.
To customize node icons:
-
Select Customize Icons from Advanced Settings.
The Custom Icons pop-up window opens.
-
Select the specification and network type of the nodes you want to customize. Then click the Select Icon menu to select an icon.
-
Click Add to add your customization as a preference. You can edit or delete this customized entry anytime.
-
Click Apply.
The customization is applied to the topology.
Note:
You can upload a custom icon by clicking on Upload From Computer. You can also delete each uploaded icon or all of them by using the Delete or Delete All buttons. Deletion operation is only applicable for uploaded custom icons, and only when it is not being used to represent any devices on the graph.
You must follow these style guidelines for uploading custom icons:
-
The icon should be of SVG format.
-
The icon should have a transparent background.
-
The icon should be white.
-
The icon should be of similar size to the ones provided by Oracle.
Customizing Edge Colors in the Topology
You can customize edge colors in the topology graph.
To customize edge colors:
-
Select Customize Colors from Advanced Settings.
The Custom Colors pop-up window opens.
-
Select the technology and rate code of the edges you want to customize. Then click the Select Style menu.
In the pop-up window, you can select any color from the gradient palette or input a specific RGBA value. You can also adjust Line Styling according to your preferences.
-
Click Add to add your customization as a preference. You can edit or delete this customized entry anytime.
-
Click Apply.
The customization is applied to the topology.


