6 Viewing the Details of Topology Components
This chapter describes how to view the details of topology components.
Viewing the Details of a Topology Component
In a topology graph, you can view the details of a topology component by clicking on it. The details appear in a side pane that contains the Overview and Alarm Details tabs. To view more information about the topology component, click More Info on the details side pane. See "Viewing Additional Information About a Topology Component" for more information.
The Overview tab displays the corresponding details of the topology component such as ID, Inventory Status, location details, entity category, subnet type, Created Date, and so on. These details vary from component to component.
The Alarm Details tab displays the list of active alarms present in the topology graph. You can see the corresponding severities of the alarms, such as Critical, Major, and Warning. You can expand each alarm to view the details.
Viewing Additional Information About a Topology Component
You can view the additional information about a selected topology component by clicking More Info on the overview details side bar that opens a summary page.
The topology component’s summary page has the following:
- General Information tab: This tab shows the details such as ID,
name, specification, location, and so on. It also shows the total capacity
available, the capacity consumed, and the percentage of the capacity consumed. You
can view the characteristics of the component (if any) in the Characteristics
side pane.
Note:
For pipe and connectivity, clicking on the ID field will take you to the corresponding summary page within UIM.
- Device Interfaces tab: This tab’s label shows the number of
device interfaces that the logical device is associated with. After you open the
tab, a list of all the device interfaces (if any) appears. From the list, you can
view the name, specification, inventory status, assigned status, and alarm status of
the device interfaces. You can select a device interface and view its summary in the
Summary for DI <ID> side pane. If a device interface has
sub-interfaces in a channelized connectivity, you can view the hierarchy of the
device interface by expanding it.
Note:
Physical device and equipment do not have Device Interfaces associated with them and therefore, the Device Interfaces tab does not appear for either of these entities. -
Associated Resources tab: The label of this tab shows the number of associated resources that the topology component has.
For example: If a Logical Device and Equipment are associated with a Physical Device, the Associated Resources tab of the Physical Device shows the Logical Device and Equipment associated with it.
After you open the tab, a list of all the associated resources (if any) appears. You can filter this list with the entity type. From the list, select a resource to view the details in the side pane. You can also view the summary of the resource from the Summary for <resource ID> side pane.
- Back button: Click this button to go back to the topology graph.
Adding Settings from a Context Menu
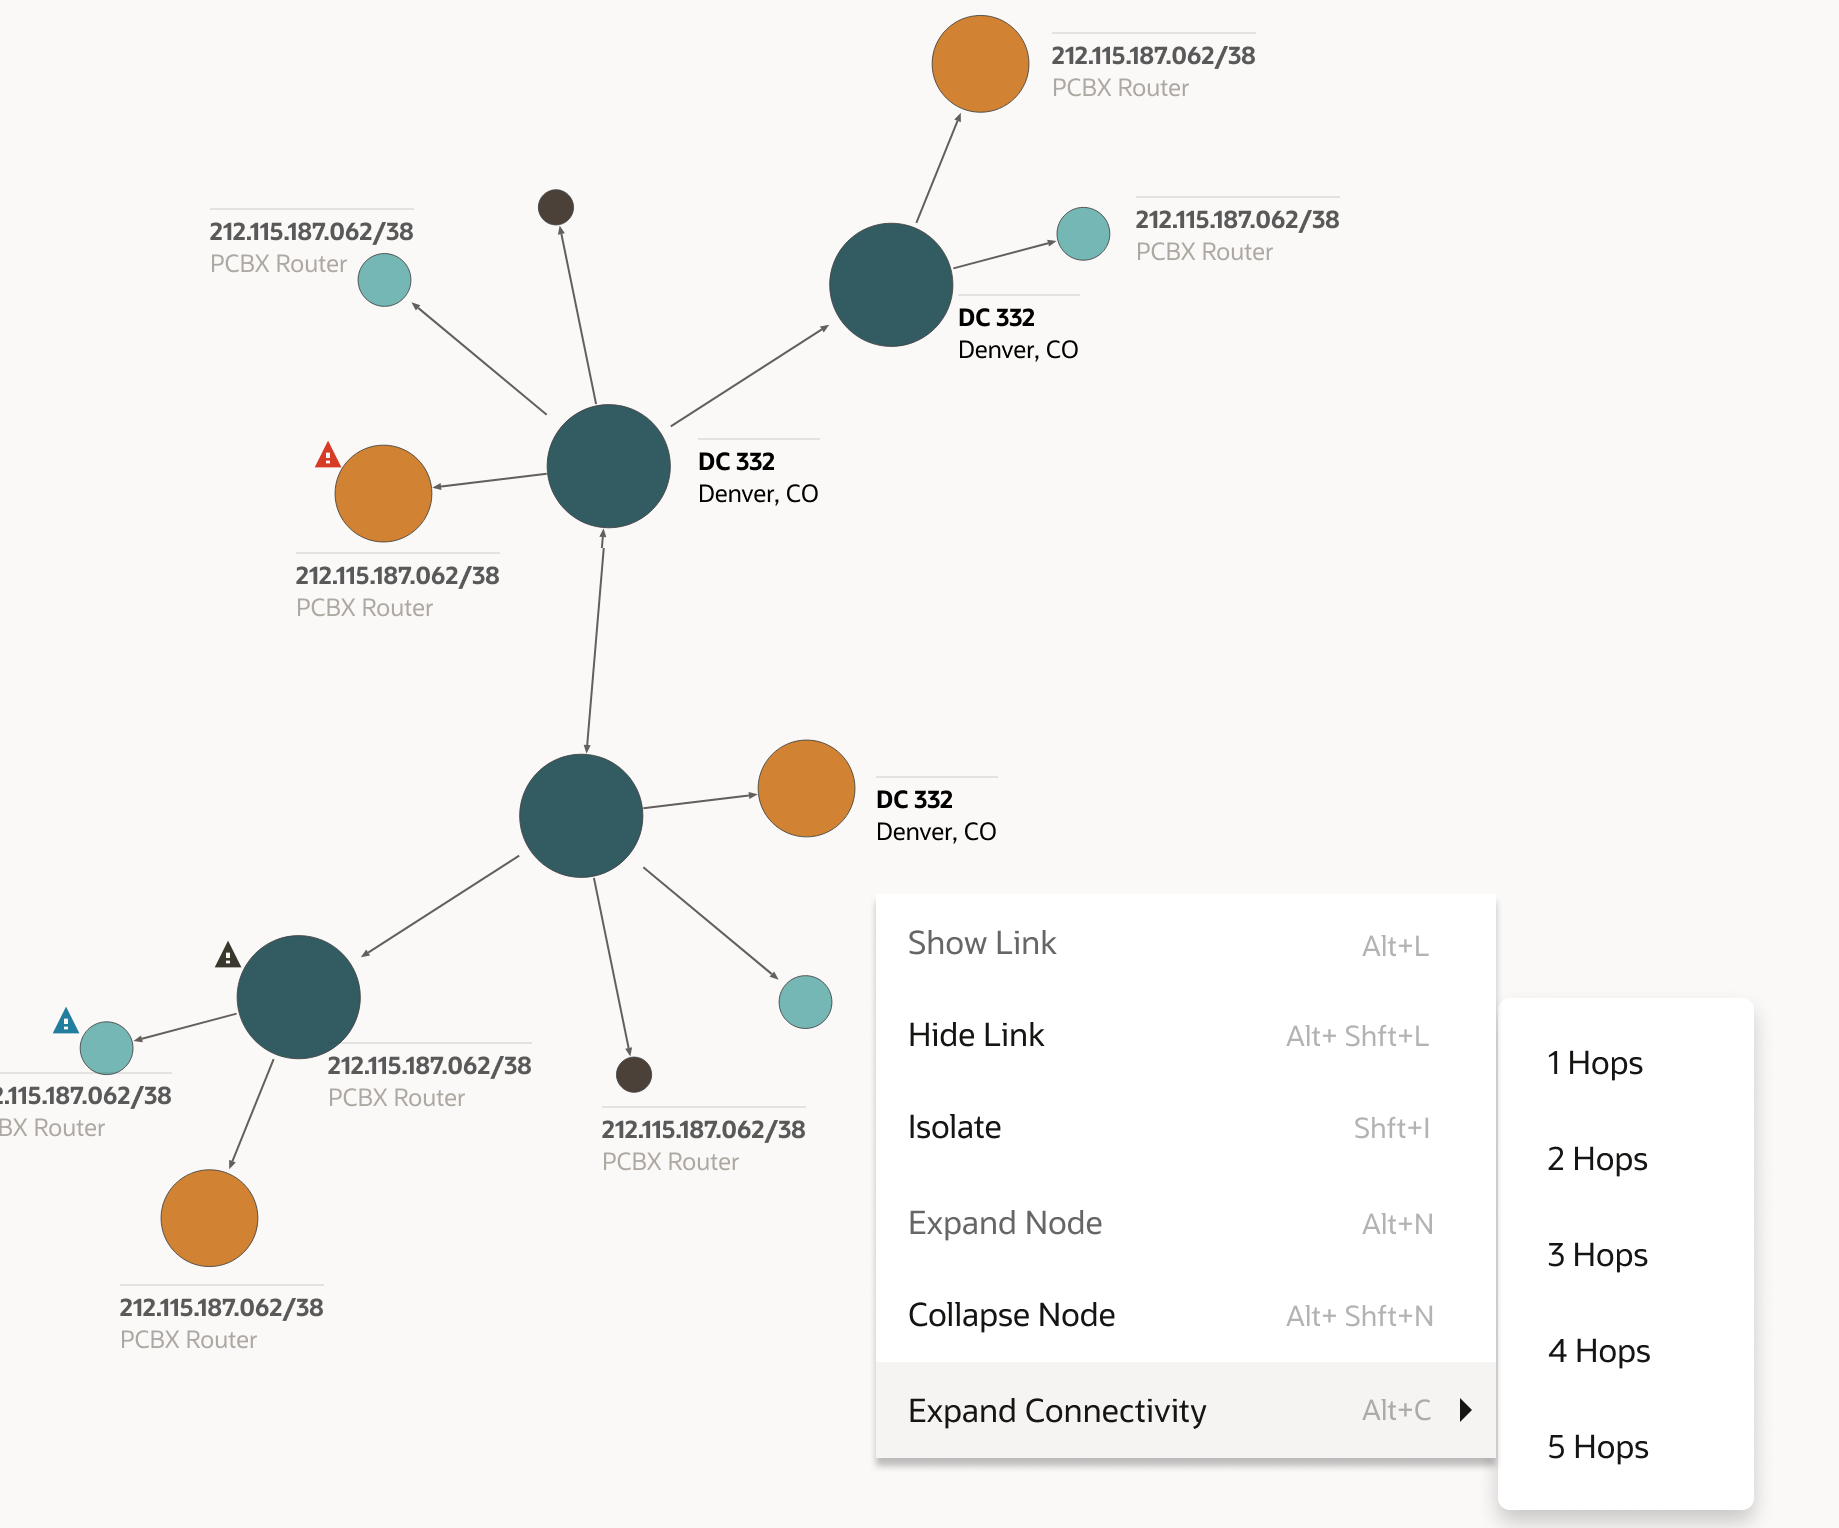
You can select a topology component and add settings using the context menu, which opens when you right-click on the component. You can also use the keyboard shortcuts for adding these settings.
Figure 6-1 shows the context menu options and the corresponding keyboard shortcuts.
You can add the following settings:
- Show Link: Displays the links that are connected to the selected component.
- Hide Link: Disables all the links that are connected to the selected component.
- Isolate: Isolates the selected component from the rest of the
topology graph. You can go back to the original topology graph by clicking
 .
.
- Expand Node: Displays all the subnetworks within the network.
- Collapse Node: Collapses all the subnetworks of the network.
- Expand Connectivity: Expands the connectivity by the number of hops that you further select.
Accessing UIM from ATA
To access UIM from ATA:
-
Open the required topology graph and select a topology component.
The overview pane of the component appears.
-
Click More Info.
The summary page of the component appears.
-
Under the General Information tab, click on the ID link.
The corresponding component's summary page in UIM appears.
