Dashboard
The Dashboard is Operations Monitor's flexible entry page. It allows you to view the information at a glance that is most important to you. Reduced panels are defined for many features of Operations Monitor, and can be displayed on the Dashboard.
Figure 3-27 Dashboard
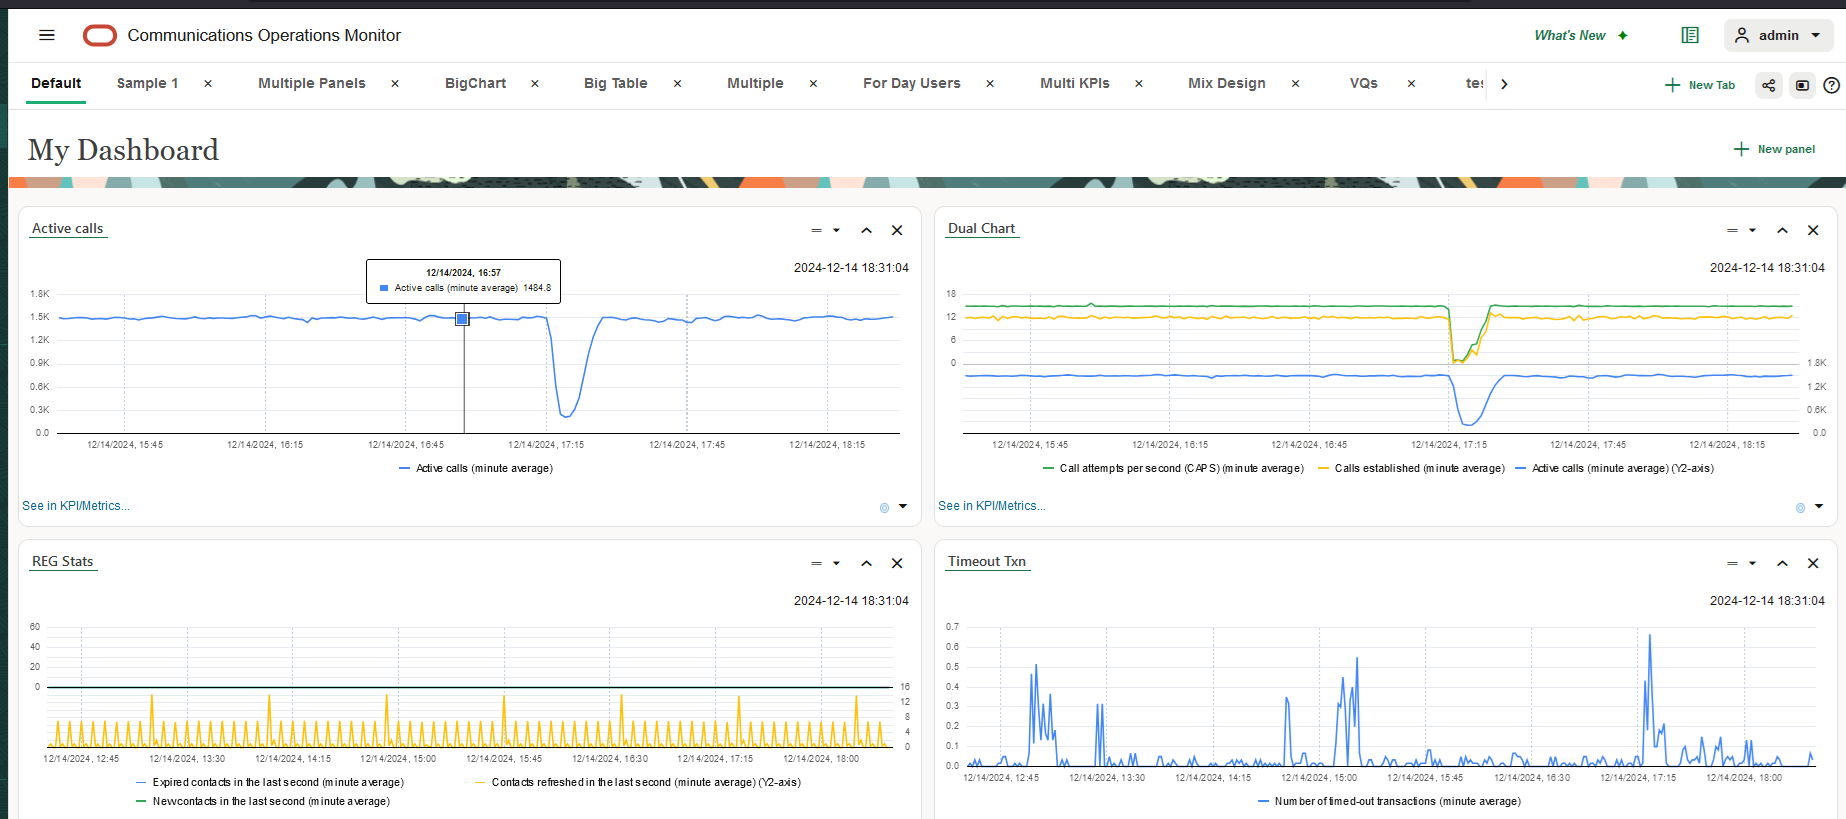
Types of panels that may appear on your dashboard are:
- Display a metric/KPI
- Display recent calls
- Display registrations
- Display subscriptions
- Display alerts
- Display voice quality data
- Display user devices chart
- Display calls by a particular user
- Display calls passing a platform device
- Display calls terminated by a platform device
- Display calls created by a platform device
- Display registrations of a particular user
- Display registrations at a particular device
- Display subscriptions of a particular user
- Display subscriptions at a particular device
- Display a device metric/KPI
- Display voice quality at a particular device
- Display Top 10 Devices
- Display Top 5 Negotiated Codecs
- Display Negotiated Codecs Distribution
Note:
Points to Note:- For the panels, Display Top 5 Negotiated Codecs and Display Negotiated Codecs Distribution, data is populated only if Platform-wide Negotiated Codec KPIs are created by the respective users.
- These panels come in variants. For example, you can display a Recent calls table only for call events passing through a certain platform device.
Understanding the Dashboard Utilities
Starting with Session Monitor Release 6.0, the Dashboard can be organized in the form of multiple Tabs .
- Improved Organization: Tabs help categorize data, making it easier to manage and access different sections.
- Faster Navigation: You can switch between tabs quickly, enabling seamless access to different views.
- Enhanced Focus: By separating content into tabs, you can focus on one section at a time
- Space Efficiency: Tabs maximize screen real estate by reducing clutter.
- User Experience: A well-organized tab structure enhances usability
- Customization: Tabs allow for easy customization and grouping of related information
What Happens to the Dashboard Panels I had Created Earlier?
A fresh installation or an upgrade to Session Monitor Release 6.0 displays the Default tab. The existing panels are added to the Default tab, and the Dashboard functionality remains the same in the Default tab. The Default tab is always a part of the Dashboard page. You cannot delete it, or rename it.
How do I start Creating Tabs on My Dashboard?
To start creating new Tabs, click + New Tab to add a new tab. You can add a maximum of 10 Tabs, including the Default tab.
Configuring Your Default Dashboard Tab
Starting with Session Monitor Release 6.0, the Dashboard can be organized in the form of multiple Tabs.
All existing panels are added to the Default tab, and the Dashboard functionality remains the same in the Default tab. The Default tab is always a part of the Dashboard page. You cannot delete it, or rename it.
Each Operations Monitor user can define their own Default tab layout. The Default tab contains four panels:
- Registrations Counter
- Active Calls Counter
- Recent Calls table
- User Devices Chart
Panels can be added, removed, and rearranged.
Panels
When you click an element in the navigation pane, a panel appears in the center of the browser window. This panel is a user interface element that displays data.
Many panels can be added to your dashboard for at-a-glance viewing. For more information, see the Dashboard section.
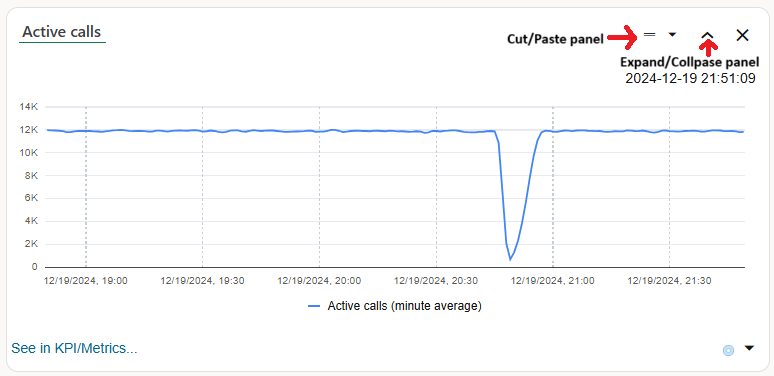
To collapse panels and display titles only, you can click the angle-bracket in the upper-right hand corner.
Figure 3-28 Panels
Another common user interface element is the tab panel.
Figure 3-29 Tabs Panel

Adding a Dashboard Panel to the Default Tab
Dashboard panels are individual components or sections within a dashboard that display specific types of data, metrics, or visualizations.
You can add Dashboard panels in the Default Tab or from the Operations Monitor pages.
To add a panel directly from the Default Tab, click + New Panel button located on the right-side corner of the Dashboard page.
A pop-up window appears that provides a list of pre-existing dashboard panels. Select a panel and click Finish to add it to the Default Tab.
Figure 3-30 Adding a Dashboard Panel to the Default Tab

Many panels can be added to your Default dashboard for at-a-glance viewing.
To collapse panels and display titles only, you can click the angle-bracket in the upper-right hand corner.
Figure 3-31 Panels
To add a dashboard panel from another window in the user interface, click the Show in Dashboard icon (shown in following figure). This button is located throughout the Operations Monitor web user interface. When you click the Show in Dashboard icon, a new panel is added in the Default tab of the Dashboard.
Figure 3-32 Show in Dashboard
To display a panel from the Default tab in any of your custom tabs, import the desired tab from the Default tab to your custom tab. For more information, see Adding a Dashboard Tab
Closing, Cutting and Pasting a Dashboard Panel from the Default Tab
- To remove/close a dashboard panel from the Default tab:
- Click the x button in the upper-right corner of the dashboard panel.
- A confirmation box appears.
- Click Yes to continue or No to cancel.
- To Cut a Dashboard Panel from the Default tab:
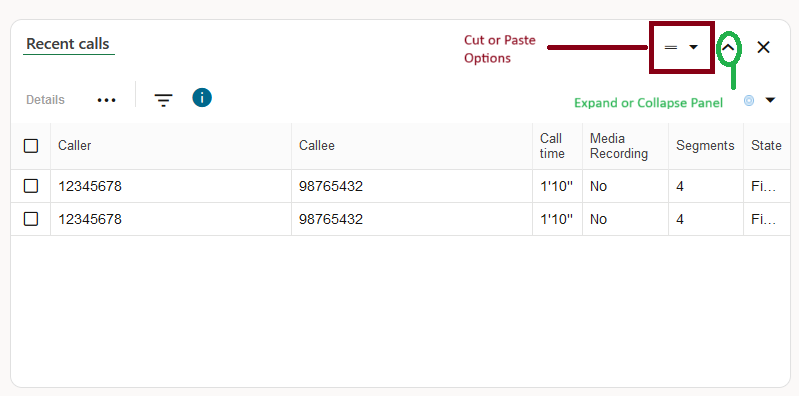
- In the Dashboard panel, from the Cut or Paste Options drop-down list, click Cut.
- To paste the dashboard panel in a new location, click the Cut or Paste Options on a panel above which you want to paste.
- Click Paste above.
Note:
You can also drag and drop to re-order the Tab positions.
Working with Dashboard Tabs
Dashboard tabs are navigation elements within the Operations Monitor dashboard that allows you to switch between different sections or views without leaving the main interface. Tabs enable you to organize data and visualizations into distinct categories or topics, enhancing the dashboard’s usability and efficiency
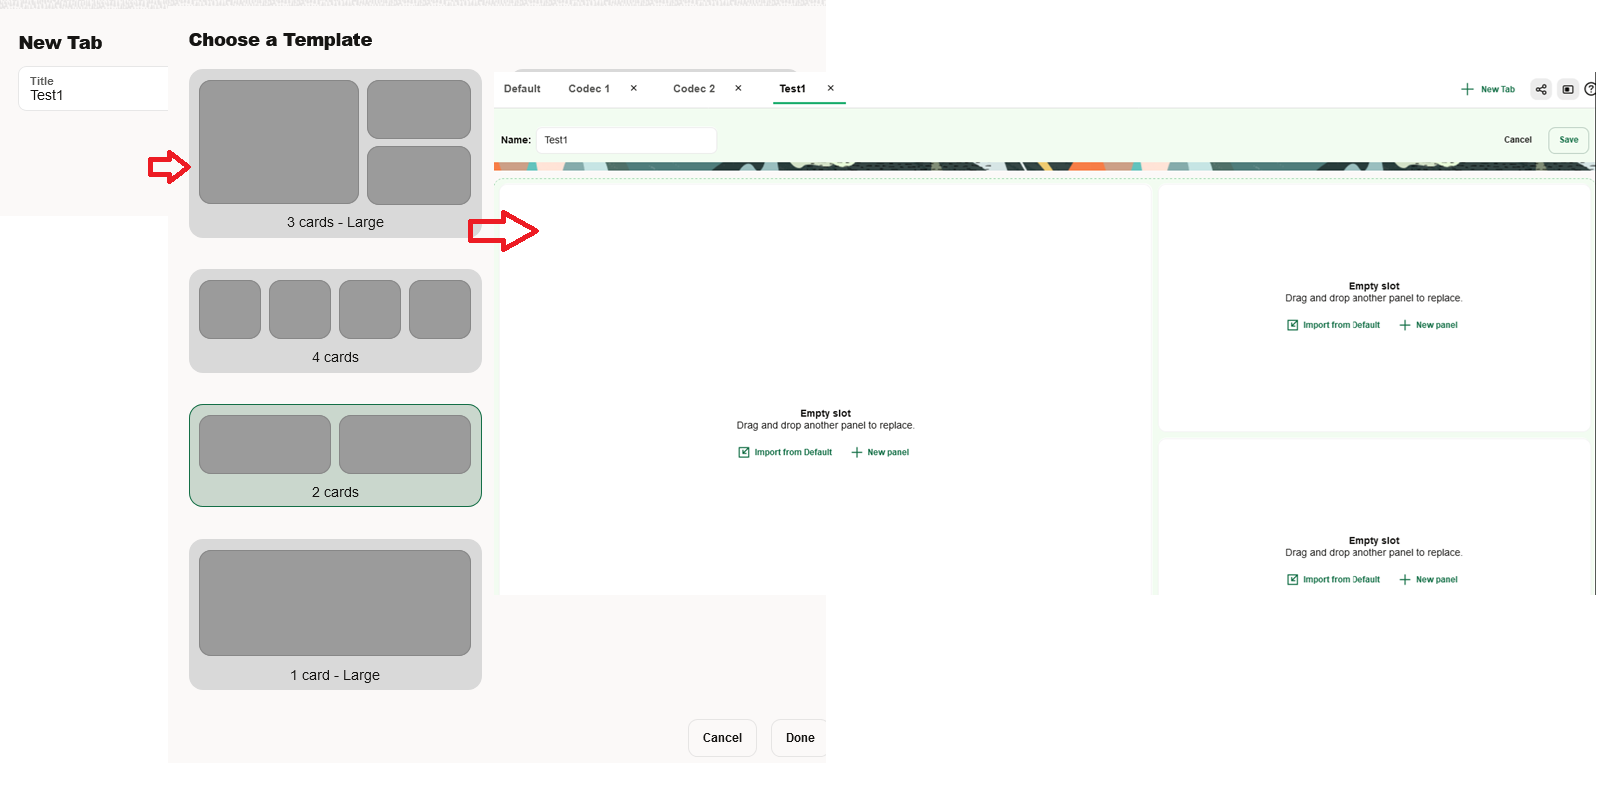
Customizable Dashboard Templates
Table 3-3 Available Templates
| Template | Description |
|---|---|
| 3 Large cardsFoot 1 | 1 large panel with 2 adjacent small panels |
| 2 Large cards | 2 large panels adjacent to each other |
| 4 cards | 4 normal sized panels adjacent to each other |
| 3 cards | 3 normal sized panels adjacent to each other |
| 2 cards | 2 normal sized panels adjacent to each other |
| 1 card | 1 normal sized panel in the entire row |
| 1 Large card | 1 Large sized panel in the entire row |
Footnote 1 Large card indicates that the height is double compared to the normal card
Adding a Dashboard Tab
This section provides information on how to add a Dashboard tab.
Editing a Dashboard Tab
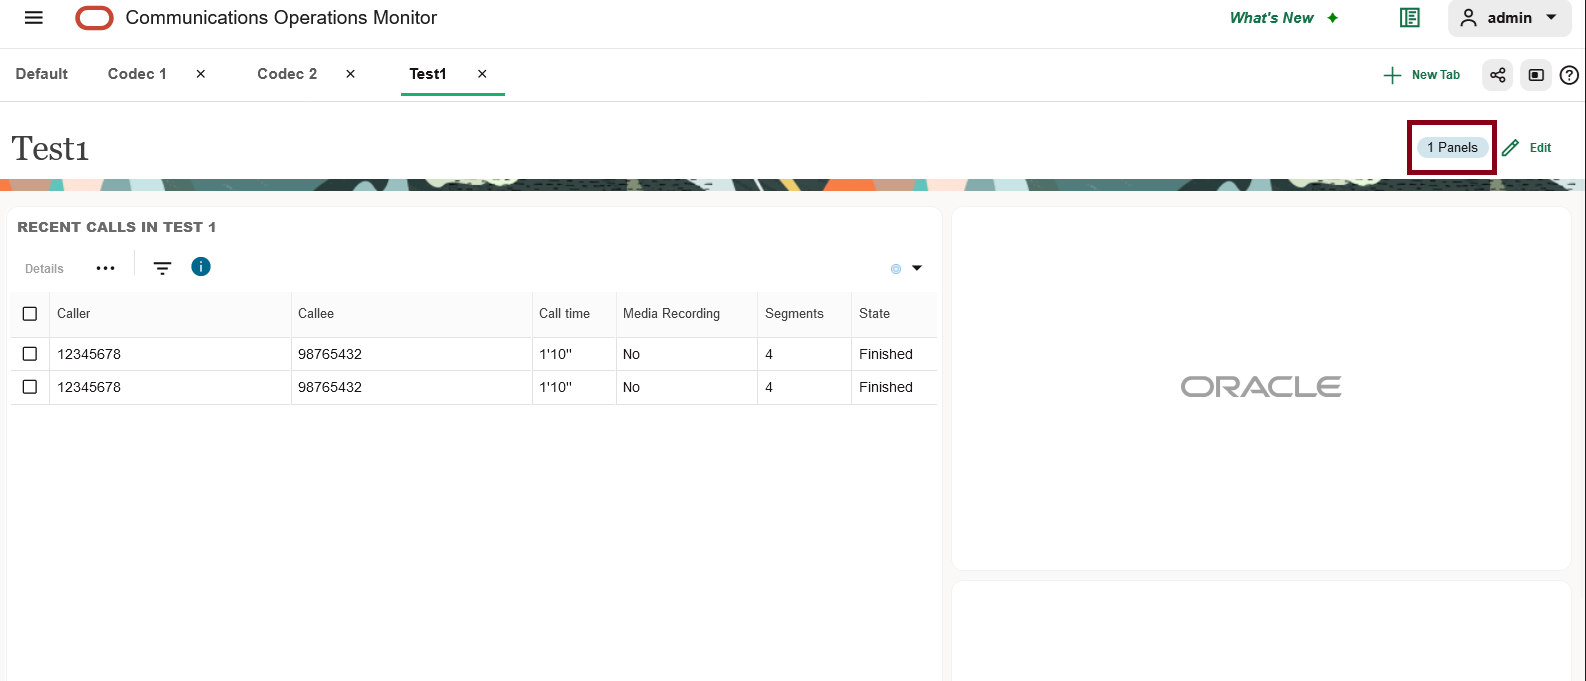
Each tab has an 'Edit mode'. The edit mode allows you to add new group, configure the group layout, and select additional panels to add within the tab. In the Edit mode you can also delete groups and the newer groups below the current group.
- For a given tab (not the Default tab), click Edit in the right-side corner of the Dashboard page.
- Click any of the following options:
- Click Add group below to add a new group.
- Click Import from Default to import a tab currently being displayed in the Default tab.
- Click + Add Panel to add a panel from the list of pre-existing panels.
- Optionally you can also:
- click the Delete button to delete a panel.
- Drag and drop panels to change the layout.
- Click Save.
Auto Switch
Session Monitor Release 6.0 provides an innovative feature called - Auto Switch, designed to enhance user experience by automatically navigating between Dashboard tabs. The Auto Switch feature enhances efficiency and simplifies the process for managing multiple dashboards simultaneously
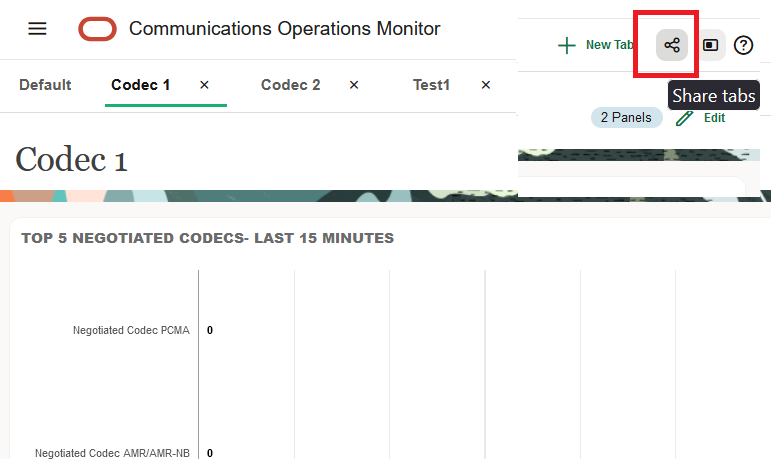
Sharing Dashboard Tabs
The admin user can share tabs with other users.
