Voice Quality
Under Operations of the main menu, the Media Summary page allows you to analyze the transmission effects of the network on the voice quality as perceived by the users of the VoIP platform. It provides a graphical overview for both platform-wide calls and device specific calls.
Voice Quality Source
Operations Monitor gathers voice quality information from four sources:
Operations Monitor RTP Probes
Probes monitor the traffic in passive mode and record several measures for each RTP stream:
-
The number of lost packets.
-
The variance of delays between the received packets (jitter).
-
The distribution of lost packets inside the stream.
-
The codec used.
Based on these values, Operations Monitor uses the ITU E-Model to estimate the MOS.
The following restrictions apply:
-
MOS is calculated for blocks of 10 seconds (chunks), if a chunk contains more than eight seconds of RTP data and contains only packets of a single audio codec.
-
No MOS is calculated if a chunk contains multiple payload types other than the telephone- event (DTMF). That is a change in audio codec or comfort noise packets will prevent MOS computation.
-
No MOS is calculated if a gap in a stream is longer than two seconds.
For the following codecs, codec-specific values for the Equipment impairment factor (Ie) and Packet-loss robustness factor (Bpl) are used in the calculation:
-
G.711 A-law (PCMA)
-
G.711 u-law (PCMU)
-
G.722
-
G.723.1
-
G.726
-
G.728
-
G.729
-
iLBC
For the following audio codecs, default values for Ie and Bpl are used.
-
AMR-NB
-
AMR-WB (G.722.2)
-
iSAC
-
OPUS
-
Speex
User Agent Statistics
Some SIP devices have the capability to include RTP statistics in a BYE message header, or in the reply to the BYE message. In general, the information provided is not enough to estimate the MOS, with the exception of the 'X-RTP-Stats' version 3 header.
The user agent statistics data is retrieved from the cache or on demand depending on the system setting. By default, the user agent statistics is always active.
Table 4-6 User Agent Headers Providing RTP Stats
| Header Name | Devices | Data Provided |
|---|---|---|
|
X-RTP-Stats (v2) |
AVM |
packet loss, jitter, burst lost, codecs. |
|
X-RTP-Stats (v3) |
AVM |
packet loss, jitter, burst lost, gaps, codecs. |
|
P-RTP-Stats |
Cisco, Linksys, Sipura |
packet loss, end-to-end latency, burst lost, codecs. |
|
RTP-RxStats |
Snom |
packet loss. |
SIP Voice Quality Events (application/vq-rtcpxr)
Some SIP devices (like: Polycom and Snom) are able to send voice quality information derived from RTCP-XR messages to Operations Monitor's voice quality collector, configurable under VQ Collector Configuration. Operations Monitor gets the values of jitter, packet loss, burst loss, and MOS from the voice quality collector to display them under the Call details info page.
Operations Monitor only reports data for end of stream statistics (CallTerm marker, refer to RFC 6035).
RTCP reports may be generated by endpoints. Such data may not be present or may not be trustworthy. Due to this we do not consider RTCP quality information for our own voice quality metrics. Nonetheless we display RTCP information to complete the view on the voice quality experienced by the users.
Voice Quality Chart
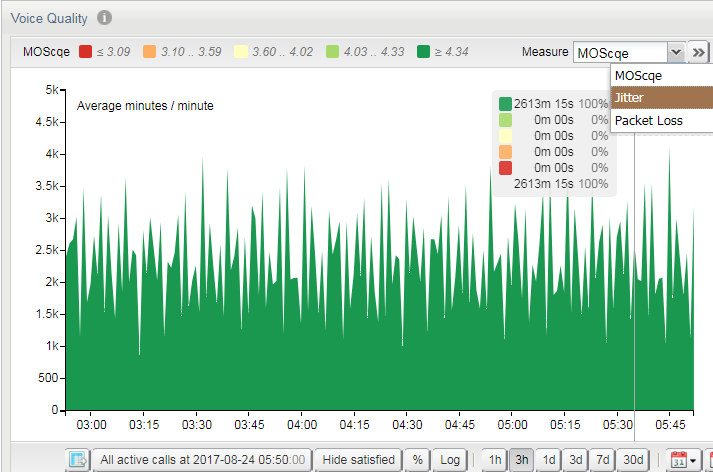
The Voice Quality page shows a stacked area chart for the MOS, Packet Loss, and Jitter measures. The Measure drop-down menu allows you to select either:
-
MOS
-
Packet Loss Rate
-
Jitter
Figure 4-43 Voice Quality Overview Chart
Voice Quality Chart for MOS
The Voice Quality page shows a stacked area chart for the MOS measure. Five series are displayed, each based the levels of user satisfaction as specified by ITU recommendation G.107.
-
Very satisfied: MOS >= 4.34
-
Satisfied: 4.03 <= MOS <= 4.33
-
Some users dissatisfied: 3.60 <= MOS <= 4.02
-
Many users dissatisfied: 3.10 <= MOS <= 3.59
-
Nearly all users dissatisfied: MOS <= 3.09
We analyze the quality of a media stream over a time interval of either one or 15 minutes (determined by the Voice Quality Chart Scale in Minutes/Minute system setting) and determine how many minutes and seconds were spent in each of the above MOS ranges. For more information, see "Voice Quality Chart Scale in Minutes/Minute" .
Over a minute a stream may have had 40 seconds with a MOS of >= 4.34, 10s between 4.34 and 4.03, and another 10s between 3.60 and 3.10. If using a 15 minute interval, the values are normalized accordingly to project the average minute and seconds over a 15 minute time period.
In this case, with 40 seconds over one minute of MOS of >= 4.34 is 00:40 minutes, but normalized over a 15 minute interval it is 10:00 minutes.
We sum up all the minutes of MOS >= 4.34 across all active media streams. This determines the height of the area labeled >= 4.34 at T=12:01.
The chart's resolution and range can be controlled with the toolbar directly below it (see Figure 4-44).
Figure 4-44 Voice Quality Chart for MOS
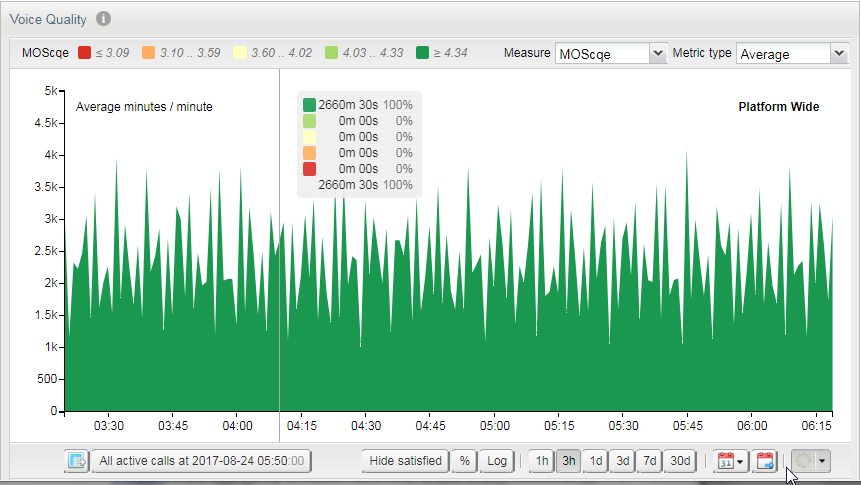
The toolbar offers couple of more options:
-
Display the active calls during a period of bad voice quality.
-
Hide statistics about streams with satisfactory quality (do not show the two best categories).
-
Switch to a percentage scale.
-
Switch to a logarithmic scale.
Additionally, you can select metric with the drop-down in the upper-right corner of the diagram. The metrics are Average (default) and Maximum.
The reason for using the Maximum metric is that for older data only hour resolution is available. A peak that happened during a couple of minutes will then be flattened out when calculating the average over one hour. By preserving the maximum value over a time period, the peaks can still be detected in old data.
When aggregating maximum values from minute to hour resolution, the sum of minutes of all voice quality levels will most likely be greater (at least equal) than that of the minute resolution. This is because the maximum value for each voice quality level over 60 minutes will be chosen.
Voice Quality chart for Packet Loss
The Voice Quality page shows a stacked area chart for the Packet Loss measure. Five series are displayed, each based on the levels of packet loss rated computed based on the raw RTP traffic.
-
Very satisfied: PL <=0%
-
Satisfied: 1% <= PL <= 4%
-
Some users dissatisfied: 5% <= PL <= 19%
-
Many users dissatisfied: 20% <= PL <= 49%
-
Nearly all users dissatisfied: PL >= 50%
We analyze the quality of a media stream over a time interval of either one or 15 minutes (determined by the Voice Quality Chart Scale in Minutes/Minute system setting) and determine how many minutes and seconds were spent in each of the above Packet Loss ranges. ranges. For more information, see "Voice Quality Chart Scale in Minutes/Minute"
The chart's resolution and range can be controlled with the toolbar directly below it (see Figure 4-45 ).
Figure 4-45 Voice Quality Chart for Packet Loss
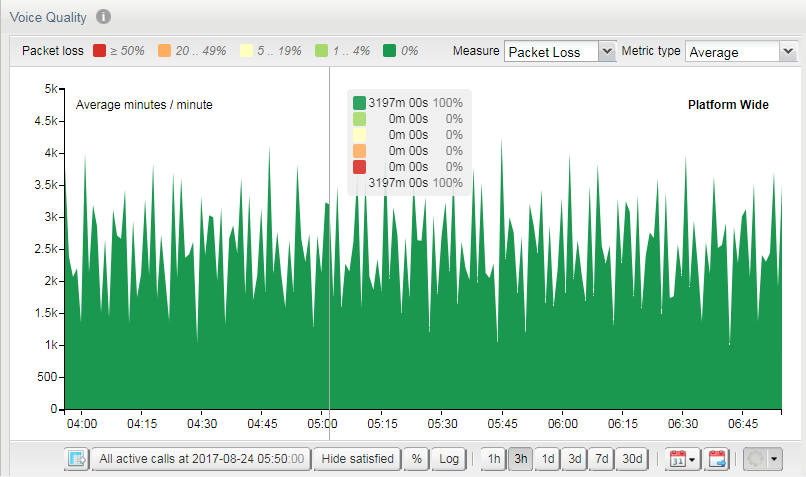
The toolbar offers couple of more options:
-
Switch to absolute values
-
Switch to a percentage scale.
-
Switch to a logarithmic scale.
Additionally, you can select metric with the drop-down in the upper-right corner of the diagram. The metrics are Average (default) and Maximum.
Voice Quality Chart for Jitter
The Voice Quality page shows a stacked area chart for the Jitter measure. Five series are displayed, each based the levels of Jitter computed based on the raw RTP traffic.
-
Very satisfied: Jitter < 10 msec
-
Satisfied: 10 msec <= Jitter <= 19 msec
-
Some users dissatisfied: 20 msec <= Jitter <= 49 msec
-
Many users dissatisfied: 50 msec <= Jitter <= 199 msec
-
Nearly all users dissatisfied: Jitter >= 200 msec
We analyze the quality of a media stream over a time interval of either one or 15 minutes (determined by the Voice Quality Chart Scale in Minutes/Minute system setting) and determine how many minutes and seconds were spent in each of the above Jitter ranges. For more information, see "Voice Quality Chart Scale in Minutes/Minute".
The chart's resolution and range can be controlled with the toolbar directly below it (see Figure 4-46).
Figure 4-46 Voice Quality chart for Jitter
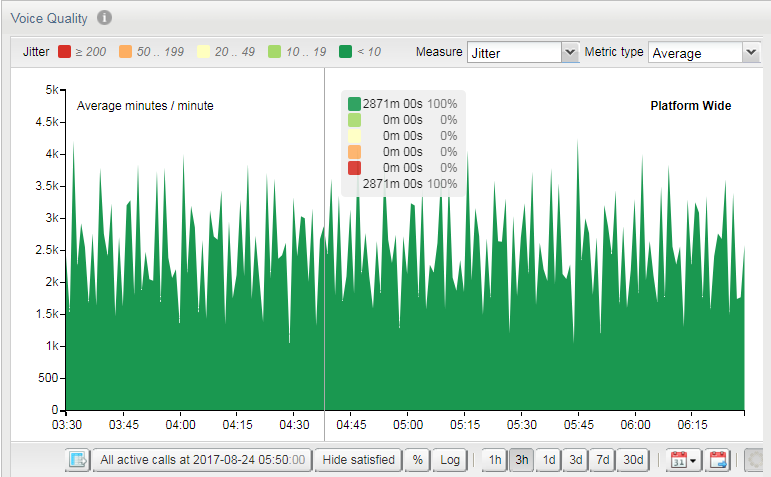
Description of "Figure 4-46 Voice Quality chart for Jitter"
The toolbar offers couple of more options:
-
Switch to absolute values
-
Switch to a percentage scale.
-
Switch to a logarithmic scale.
Additionally, you can select metric with the drop-down in the upper-right corner of the diagram. The metrics are Average (default) and Maximum.
Note:
Only voice quality measurements calculated by the Operations Monitor probes are shown in this chart. This monitoring has certain limitations:
-
Voice quality (MOS, packet loss, and jitter) is calculated for blocks of 10 seconds (chunks), if a chunk contains more than eight seconds of RTP data of a single supported codec. For more information, see "Operations Monitor RTP Probes".
-
Chunks shorter than 10 seconds are normally not shown.
-
Streams containing larger gaps (that is due to comfort noise) might be shown as two separate streams.
-
Streams that are not matched to calls (no correlation between SDP record received in a SIP message and RTP IP/ports) are not included in Operations Monitor's KPIs.
CSV Export
You can export voice quality data for the displayed period by pressing the CSV export button. The CSV export dialog will open, and when ready provide you with a downloadable CSV file.
Table 4-7 lists the fields that are exported:
Table 4-7 CSV Export Fields
| Name | Format | Example |
|---|---|---|
|
Local timestamps |
human readable |
7/25/2017 13:42 |
|
UTC timestamps |
ISO 8601 |
2014-07-25T11:42:00Z |
|
Interval |
integer |
60 |
|
MOS: 0 .. 3.09 |
integer |
300 |
|
MOS: 3.10 .. 3.59 |
integer |
329 |
|
MOS: 3.60 .. 4.02 |
integer |
28 |
|
MOS: 4.03 .. 4.33 |
integer |
255 |
|
MOS: 4.34 .. 5 |
integer |
212 |
The MOS fields contain the number of seconds of each voice quality level, for the time period given in seconds in the Interval field. The interval depends on the available resolution for the time period: either minute or hours. If minute resolution values are available, Interval is typically 60, otherwise 3600. The Interval can in rare cases be less than 60 or 3600, if the machine was rebooted or was down when the measurement period started.
Minute values are only available for the last couple of days.
Active Calls During a Period of Bad Quality
Selecting a time on the main chart will update the Active calls button below the chart. This button navigates to the calls page, appropriately filtered to display only calls active at that time.
Voice Quality Charts Per Device
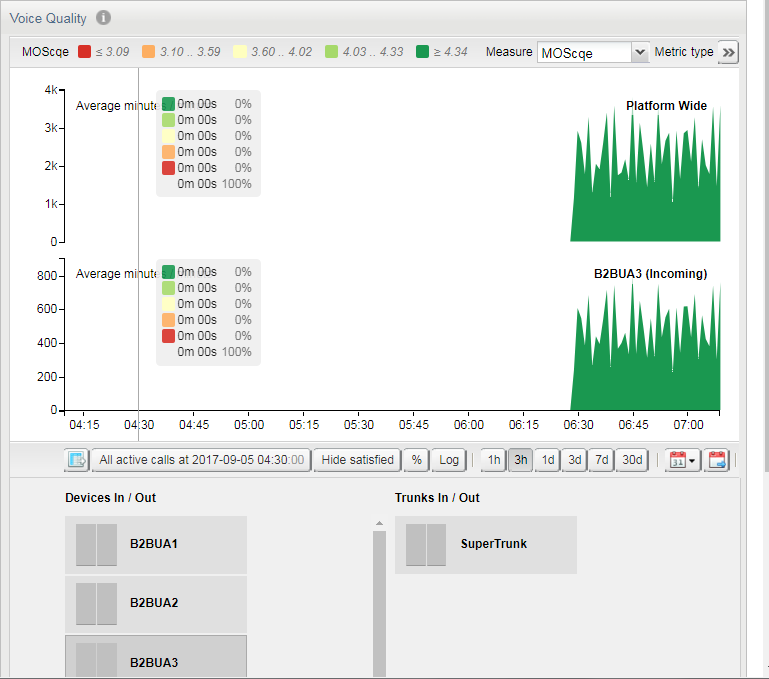
To help diagnose areas of particularly bad MOS, clicking on the main chart at time T loads the Voice Quality data for all platform devices at that time. The MOS stats for a device are displayed next to it. The devices are sorted by MOS quality, those with bad quality at the selected time are listed first.
Clicking on a device augments the main chart with a second chart displaying the Voice Quality for the currently active time resolution and range (see Figure 4-47).
The following two voice quality charts are available for each device, trunk, and IP tag:
-
Distribution of incoming calls by MOS ranges, packet loss ranges, and Jitter ranges over the time.
-
Distribution of outgoing calls by MOS ranges, packet loss ranges, and Jitter ranges over the time.
Media Summary
You can see the media summary information of any call listed in the Calls table.
To view the media summary details:
-
Double-click a row in the Calls Table.
The Call Info window opens.
-
Click the Media Summary tab which opens a textual report of the voice quality data for the call.
Table 4-8 describes the fields in the Media Summary tab.
Table 4-8 Media Summary Fields
| Field | Description |
|---|---|
|
Average jitter |
The average of the measured jitter values of the 10 seconds intervals. |
|
Average MOS |
The average of the estimated MOS values of the 10 seconds intervals. |
|
First packet |
The time stamp of the first RTP packet from the stream. |
|
Last packet |
The time stamp of the last RTP packet from the stream. |
|
Maximum jitter |
The maximum of the measured jitter values of the 10 seconds intervals. |
|
Minimum MOS |
The minimum of the estimated MOS values of the 10 seconds intervals. |
|
Packet loss rate |
The number of received RTP packets divided by the number of expected RTP packets. |
|
Packets lost |
The total number of RTP packets that were lost for this stream. This can have multiple causes:
|
|
Packets received |
The total number of RTP packets that were received in the stream. |
|
Reporter |
The source of the report:
|
|
Total jitter |
The sum of the measured jitter values of the 10 seconds intervals. |
|
VLAN |
The VLAN tag of the RTP packets |
Media Details
The Media Details tab displays an estimation of the MOS value for each RTP stream. This data is collected by Operations Monitor RTP probes or may be provided by SBCs in interim media QoS reports. The data is arranged on a grid in 10 second intervals.
You can see the media details grid for any call listed in the Calls table.
To view the media details grid:
-
Double-click a row in the Calls table.
The Call Info window opens.
-
Click the Media Details tab which opens a grid report of the media details for the call.
-
Hover over any block on the grid; a tooltip displays data for the interval.
Note:
Voice quality report intervals may align differently on the grid, depending on the data source. Intervals reported by Session Monitor probes are aligned to a global grid at 10-second boundaries. Intervals reported by SBCs may not be aligned to this grid because they are provided every 10 seconds after the stream began.
