Trunks/Prefixes
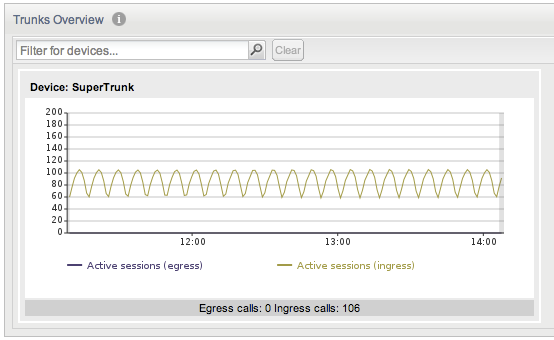
The Trunks/Prefixes page presents an overview of the status of all configured trunks and prefixes on the monitored platform. The Active sessions chart displays the number of inbound (ingress) and outbound (egress) sessions for each trunk or prefix (see Figure 4-60).
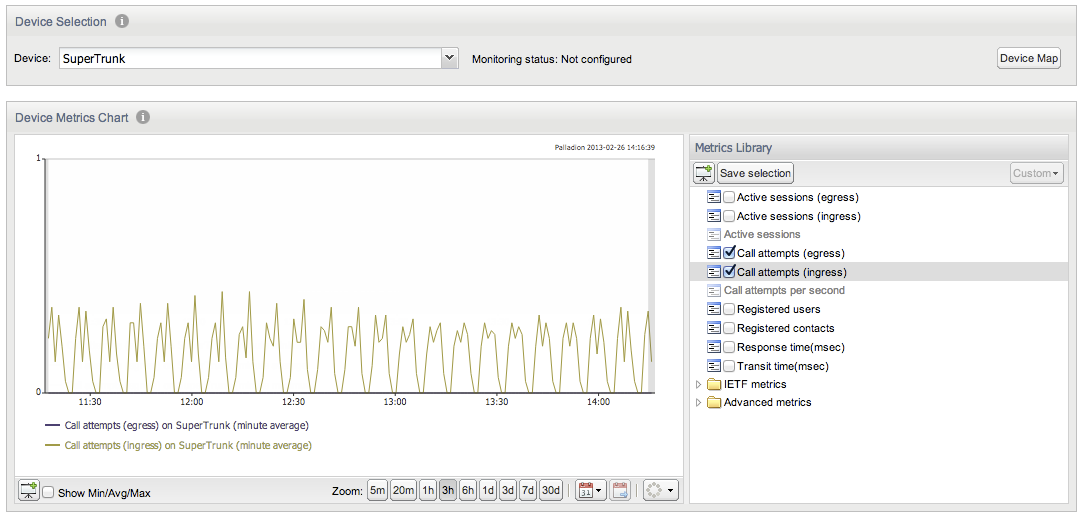
The metric displayed in the chart can be configured in the Device page. To change the metric to display for a trunk, select the metric from the Metric Library and click Save selection, as shown in Figure 4-61.
Figure 4-61 Configuring the Metric to Display for a Trunk

Description of "Figure 4-61 Configuring the Metric to Display for a Trunk"
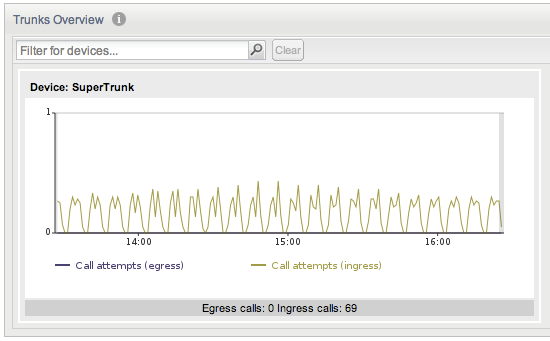
After the change, the Call attempts chart is displayed for the SuperTrunk (see Figure 4-62).
When you click on a trunk (outlined in white as illustrated in Figure 4-62), you are taken to the Devices page for this trunk. Clicking on a prefix has no effect. The Trunks/Prefixes page also features a Refresh button, which can be used to control the update interval for the textual information contained on the page.

