Network
The Probes page helps you define the remote agents that are pushing the data to the Mediation Engine of Operations Monitor. To access the Probes page, from the Settings menu, select Network, and then select Probes.
Probes
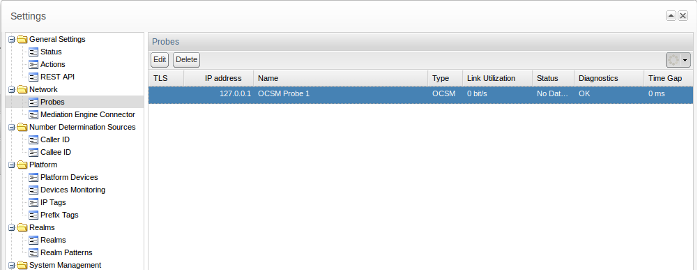
If your Operations Monitor installation has been configured to use probes on remote machines for traffic sniffing, you may view or edit those probes via this panel. By default, Operations Monitor will treat the local machine as its one and only probe (see Figure 7-3).
SBC probes are not configured using Operations Monitor, but it is possible to edit their names and IP addresses using the Probes panel. Users can remove probes using the Remove button in the probes list dialog box, but if a probe still exists, it will eventually reappear in the list of probes. Use the column Status to verify if your settings are correct and Operations Monitor can connect to the probes.
There is a process that searches for new probes at a given time interval. If they are correctly configured they will appear in the Probes configuration panel. When a probe is removed from the network, it should also be removed from the list.
Table 7-2 lists the columns in the Probes panel and the information that is shown for each probe:
Table 7-2 Probe Panel Columns
| Column | Description |
|---|---|
|
TLS |
A lock appears if the connection with this machine is encrypted. |
|
IP address |
The IP address of the probe that will be used. |
|
Name |
A name to identify the probe. Can be edited by the user. |
|
Type |
Two types of probes are shown:
|
|
Link Utilization |
This column shows the traffic volume in bits per second if the probe is reachable. |
|
Status |
The value of this cell depends of the data received. If no received data is shown, that may indicate a potential problem. |
|
Diagnostics |
Shows information about possible errors that can appear in probes configuration, such as IP conflicts and counters mis-configuration. In the latter case, a button will let the Administrators manually create the missing counters. |
|
Time Gap |
Absolute time difference between the Operations Monitor instance and the probe in milliseconds. If the difference is bigger than the established maximum value, the value will appear in red color and an alert symbol will appear in the dashboard, noticing that there is a significative time difference. The setting name for the time difference probe value alert is Time difference in probes that will trigger an alert. |
There are two KPIs that are associated with each added probe:
-
Bandwidth, which is the amount of traffic, both forwarded by the probe in bits/second. Includes signal and also voice if it was recorded and forwarded to the Mediation Engine (ME).
-
Impairment, which is a Boolean value. Has the value of 1 for each minute that a problem has been detected with the probe. For more information on the problem the system log should be consulted.
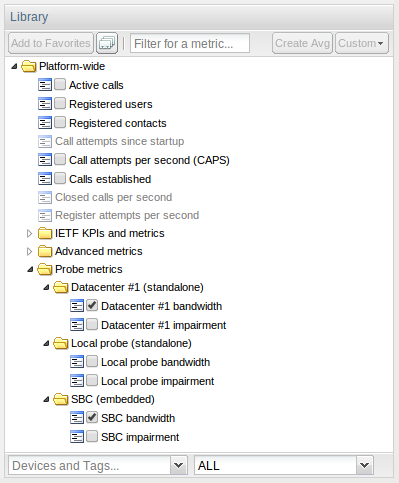
Probe metrics are shown in the KPI/Metrics page, inside its own folder, as shown in Figure 7-4.
Figure 7-4 Library View of the Probe metrics Folder

Description of "Figure 7-4 Library View of the Probe metrics Folder"
Mediation Engine Connector
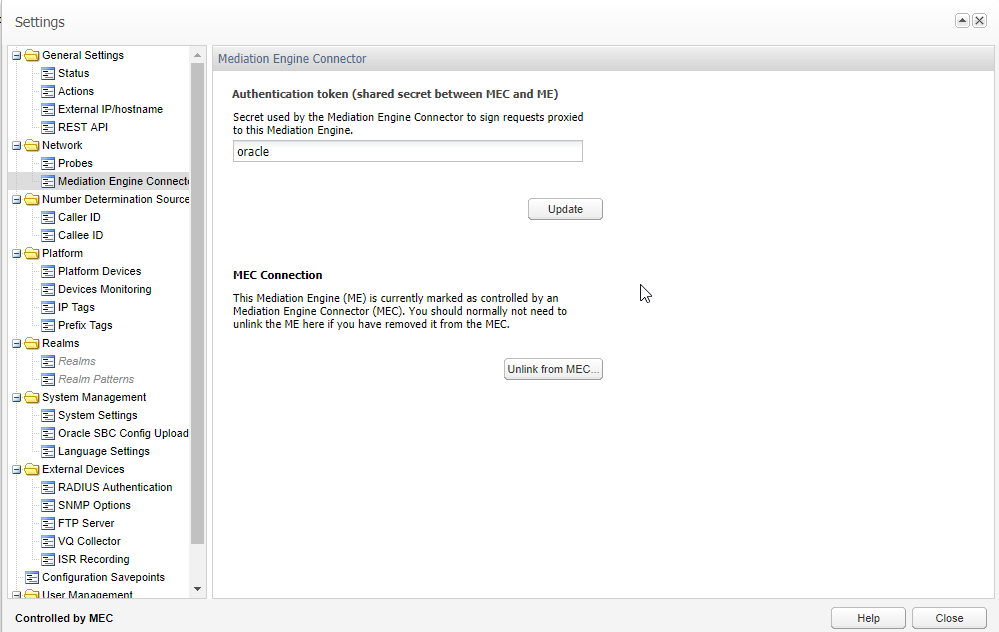
If Operations Monitor installation has been configured to use a Mediation Engine Connector, the authentication token, which this Mediation Engine uses to authenticate itself to the Mediation Engine Connector, can be configured on this page as shown in Figure 7-5.
Figure 7-5 Authentication Token Configuration

Description of "Figure 7-5 Authentication Token Configuration"
To configure Mediation Engine Connector:
-
Log into Operation Monitor.
-
Click Admin and then click Settings.
-
Click Network.
-
Click Mediation Engine Connector.
-
In the Authentication Token field, enter your choice of token details for the Mediation Engine, and click Update.
Result: Mediation Engine connects with the Mediation Engine Connector.
Note:
You must note down the token details for future reference.
-
(Optional) Perform the following steps if you have disabled the Mediation Engine.
-
Log into Mediation Engine.
-
Under Settings, click ME Management.
-
Select the node and double-click the disabled column field select yes from the drop-down list.
Note:
If a node is marked as Disabled, the devices do not propagate to other Mediation Engines and the other Mediation Engine Connector controlled node Mediation Engines do not query for retrieving information about calls.
-
Click Save.
-
Result: Mediation Engine is added.
Disconnecting Mediation Engine from Mediation Engine Connector
To disconnect Mediation Engine from Mediation Engine Connector:
-
Log into Operation Monitor.
-
Click Admin and then click Settings.
-
Click Network.
-
Click Mediation Engine Connector.
-
Click Unlink from MEC….
Result: The Mediation Engine is disconnected from Mediation Engine Connector.
Note:
Though, Mediation Engine disconnected from Mediation Engine Connector, Mediation Engine details appears in the mediation engine list in the ME Management screen. To remove the Mediation Engine from the list, navigate to ME Management, select the mediation engine, click Delete Selected and the click Save. If you click Replicate Configuration, the mediation engine will connect back to the Mediation engine connector. Make sure to note down all the fields of this entry before disconnecting for future reference.
